Figures & data
Table 1 Patients’ characteristics
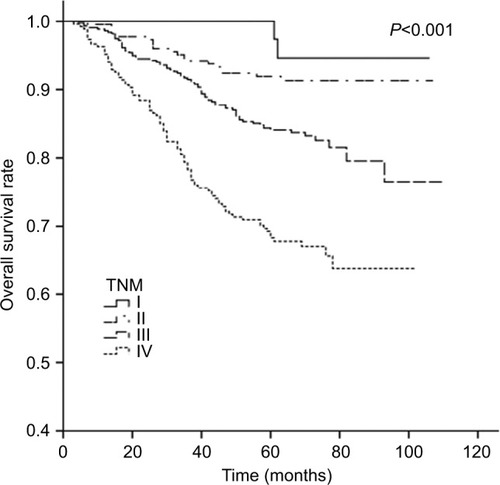
Figure 1 Cumulative survival curves according to primary tumor volume (TV).
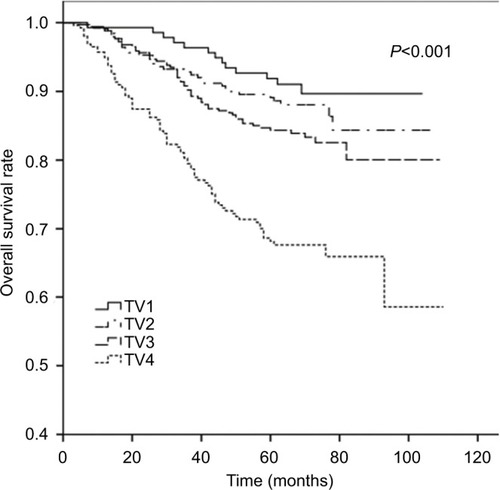
Figure 2 Cumulative survival curves according to nodal volume (NV).
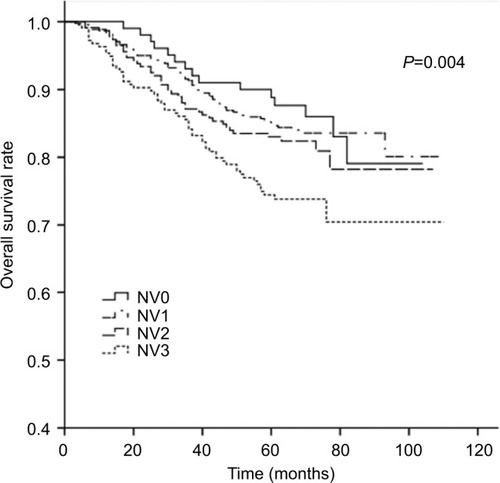
Figure 3 The 5-year overall survival curves for the 16 subgroups and the corresponding establishment of groups, G1–G4.
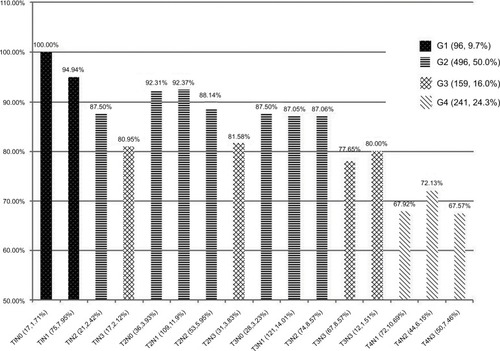
Table 2 Treatment outcomes of the different tumor burden
Figure 4 Cumulative survival curves according to tumor burden.
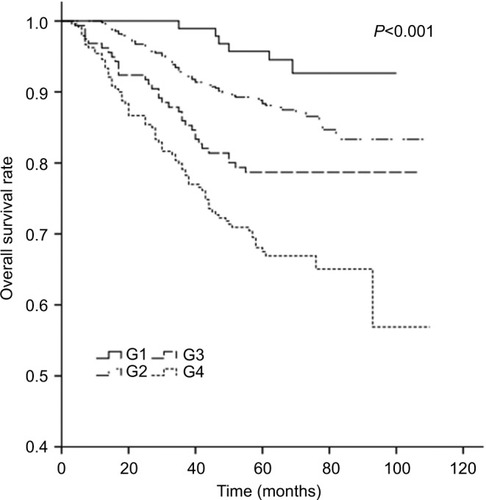
Figure 5 Cumulative survival curves according to AJCC TNM-staging (seventh edition, 2010).Citation23
Abbreviation: AJCC, American Joint Committee on Cancer.