Figures & data
Figure 1 Deguelin inhibited proliferation of human colorectal cancer cell lines in a dose- and time-dependent manner.
Notes: Cell viability was determined using the CCK-8 assay. (A) SW480, (B) SW620, and (C) RKO cells were treated without or with different concentrations of deguelin for 24 and 48 hours. The IC50 of deguelin for 24 hours in SW480 and SW620 were 122.02 nM and 36.57 nM, respectively. And the IC50 of deguelin for 48 hours in SW480, SW620, and RKO cells were 40.86 nM, 17.73 nM, and 13.25 µM, respectively. (D) SW480 and (E) SW620 cells were cultured with deguelin (100 nM) for different time points. (F) RKO cells were cultured with deguelin (10 µM) for different time points. The data are presented as mean ± SEM for three different experiments performed in triplicate. *P<0.05, **P<0.01 and ***P<0.001, compared to control group.
Abbreviations: CCK-8, cell counting kit-8; IC50, 50% inhibitory concentrations; SEM, standard error of the mean.
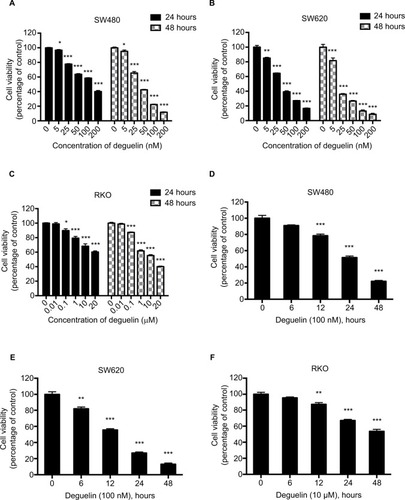
Figure 2 Deguelin induced apoptosis in human colorectal cancer cell lines.
Notes: Cell apoptosis was evaluated by flow cytometry after annexin V and PI staining as described in the “Materials and methods” section. SW620 cells were treated without or with different concentrations of deguelin for (A) 24 hours or (B) 48 hours. RKO cells were treated without or with different concentrations of deguelin for (C) 24 hours or (D) 48 hours. The data are presented as the mean ± SEM of three independent experiments. *P<0.05, **P<0.01 and ***P<0.001, compared to control group.
Abbreviation: SEM, standard error of the mean.
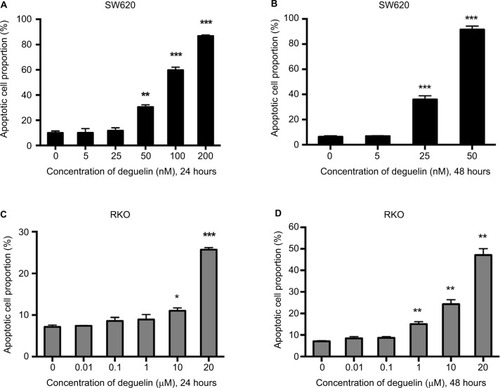
Figure 3 Deguelin inhibited tumor growth in the xenograft mouse model.
Notes: (A) Deguelin administration had no significant effect on body weight. (B) Tumor volumes were measured every 3 days after the palpable tumors reached 50– 100 mm3. Tumor growth was significantly inhibited after exposure to deguelin for 12 days compared to the control group. (C) Tumor weight was assessed on sacrificed mice, suggesting a significantly decreased tumor weight in mice treated with deguelin. (D) Representative images of gross morphology. (E) TUNEL assay revealed a higher apoptotic rate in deguelin-treated mice (N=6 for each group). *P<0.05, **P<0.01 and ***P<0.001, compared to control group.
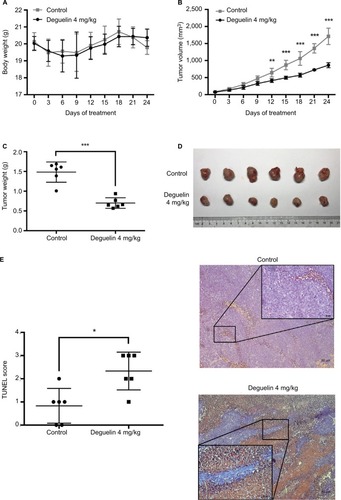
Figure 4 Deguelin induced apoptosis in colorectal cancer cells via activation of p38 MAPK pathway.
Notes: (A) RKO and (B) SW620 cells were treated with indicated concentrations of deguelin for 24 hours. The total lysates were subjected to Western blot analysis, and β-actin was used as an internal reference. (C) Analysis of MAPK and NF-κB pathways after deguelin treatment. As a result, phosphorylated form of p38 was upregulated, while no obvious changes were detected in p-JNK, p-ERK1/2, or p65. Administration of SB203580 at a dose of 10 µM, a specific inhibitor of p38 MAPK, could reverse deguelin-induced (E) cell proliferation inhibition and (D and F) apoptosis in RKO cells. Briefly, SB203580 was dissolved in DMSO at 10 mM as stocking solution, which was further diluted into 10 µM as working solution. **P<0.01 and ***P<0.001, compared to control group.
Abbreviations: DMSO, dimethylsulfoxide; NS, not significant.
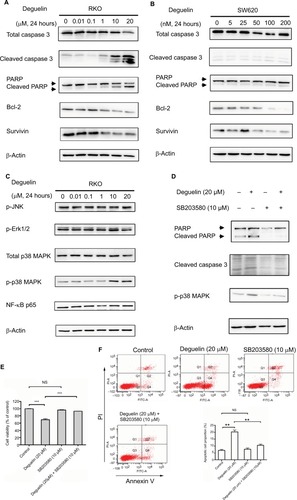
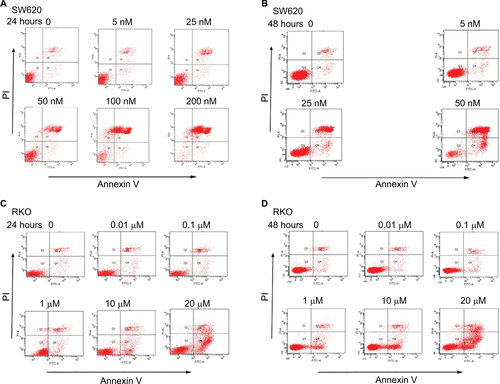
Figure S1 Representative images of cell apoptosis induced by deguelin.
Notes: SW620 cells were treated without or with indicated concentrations of deguelin for (A) 24 hours or (B) 48 hours. RKO cells were treated without or with indicated concentrations of deguelin for (C) 24 hours or (D) 48 hours.