Figures & data
Table 1 Microarray databases detailing the mRNA expression of ECT2 (these databases were included in the meta-analysis)
Table 2 Correlation between ECT2 expression and the clinicopathological features of 202 lung cancer patients on TMAs (BC041115c and HlugA180Su05)
Figure 1 ECT2 was enriched in various subtypes of lung cancer.
Notes: (A) Representative images of IHC staining of normal, squamous cell carcinoma, adenosquamous carcinoma, adenocarcinoma, bronchioloalveolar carcinoma, large cell carcinoma, small cell carcinoma, and atypical carcinoid; (B) quantitative IHC scores of ECT2 in various lung cancer subtypes; (C) meta-analysis of ECT2 mRNA expression in tumors vs normal; (D) meta-analysis of ECT2 mRNA expression in SQC vs ADC.
Abbreviations: ECT2, epithelial cell transforming sequence 2; IHC, immunohistochemical; T, tumor; N, normal; OR, odds ratio; ADC, adenocarcinoma; SQC, squamous cell lung cancer.
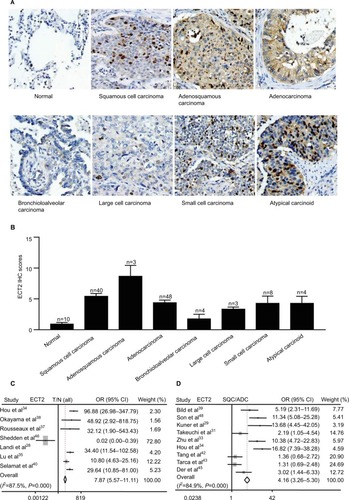
Figure 2 Protein level of ECT2 was associated with cancer progression and prognosis.
Notes: (A) Representative images and IHC scores of ECT2 in tumor vs matched adjacent tissue; (B) various stages; (C) various degrees of tumor cell differentiation; (D) various tumor sizes; (E) lymph node positive vs lymph node negative. N−, lymph node negative; N+, lymph node positive.
Abbreviations: ECT2, epithelial cell transforming sequence 2; IHC, immunohistochemical.
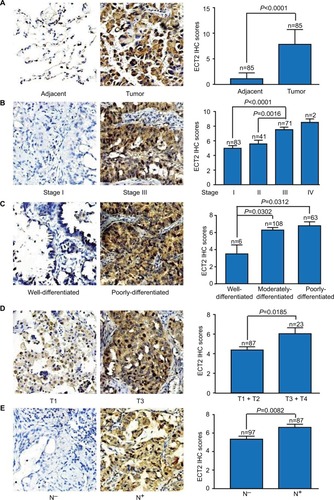
Figure 3 mRNA level of ECT2 was associated with cancer progression and prognosis.
Notes: (A) Meta-analysis of ECT2 mRNA expression at stage III + IV vs I + II; (B) stage III + IV vs I + II in ADC; (C) stage III + IV vs I + II in SQC; (D) tumor size T3 + T4 vs. T1 + T2; (E) lymph node positive vs lymph node negative; (F) the mRNA expression of ECT2 at different degrees of tumor cell differentiation in GSE68465. N−, lymph node negative; N+, lymph node positive.
Abbreviations: ECT2, epithelial cell transforming sequence 2; IHC, immunohistochemical staining; CGARN, Cancer Genome Atlas Research Network; OR, odds ratio; ADC, adenocarcinoma; SQC, squamous cell lung cancer.
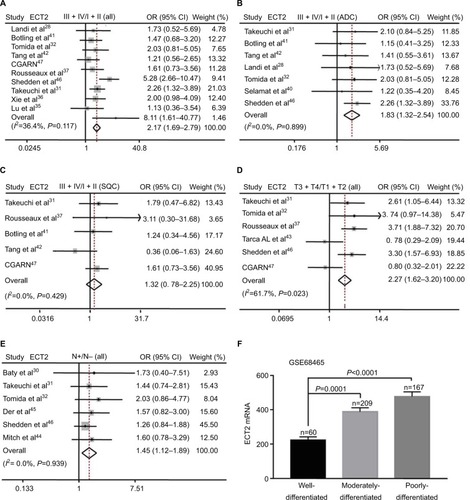
Table 3 ECT2 expression in ADC is an independent prognostic factor for ADC patients (HlugA180Su05)
Figure 4 Overexpression of ECT2 protein predicted poor survival.
Notes: Kaplan–Meier curve of patients with low or high ECT2 expression in ADC. Median level of IHC scores was used to divide patients into subgroups;
Abbreviations: ECT2, epithelial cell transforming sequence 2; HR, hazard ratio; ADC, adenocarcinoma; IHC, immunohistochemical staining.
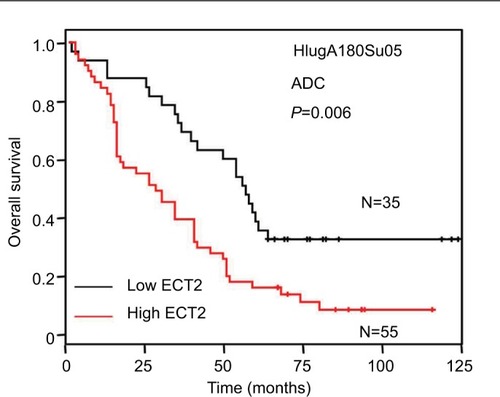
Figure 5 ECT2 expression correlated with PCNA expression.
Notes: (A) Representative images of IHC staining of PCNA; (B) representative images of IHC staining of PCNA and ECT2 in the same lung cancer tissues; (C) IHC scores of PCNA in lung cancer; (D) the correlation between ECT2 and PCNA based on protein expression; (E) based on the mRNA level of the GSE4342 cell line; (F) GSE32474 cell line; (G) GSE31210 cell line; (H) GSE68465 cell line; (I) GSE30219 cell line. N−, lymph node negative; N+, lymph node positive.
Abbreviations: IHC, immunohistochemical staining; PCNA, proliferating cell nuclear antigen; ECT2, epithelial cell transforming sequence 2; HR, hazard ratio; ADC, adenocarcinoma; SQC, squamous cell lung cancer.
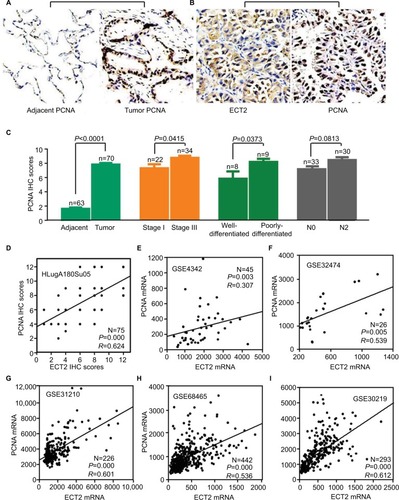
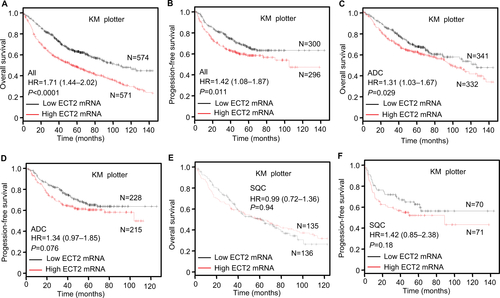
Figure S1 Overexpression of ECT2 mRNA predicted poor survival.
Notes: Kaplan–Meier curve of patients with low or high ECT2 expression. Median of mRNA expression was used to divide patients into subgroups. (A) Overall survival; (B) progression-free survival; (C) overall survival in ADC; (D) progression-free survival in ADC; (E) overall survival in SQC; (F) progression-free survival in SQC.
Abbreviations: ECT2, epithelial cell transforming sequence; HR, hazard ratio; ADC, adenocarcinoma; SQC, squamous cell lung cancer.