Figures & data
Figure 1 Expression distribution of MCM2–7 in human normal organ tissues.
Notes: Expression distribution box plot of MCM2 (A); MCM3 (B); MCM4 (C); MCM5 (D); MCM6 (E); MCM7 (F).
Abbreviation: MCM, minichromosome maintenance.
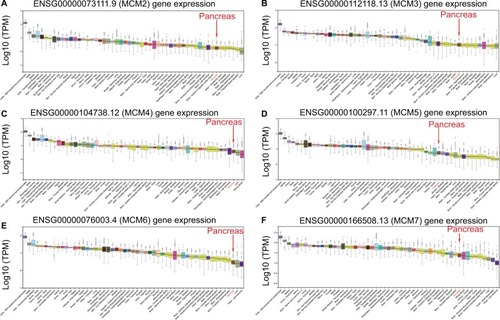
Figure 2 Expression distribution of MCM2–7 between PAAD tumor and normal tissues.
Notes: Expression distribution box plot of MCM2 (A); MCM3 (B); MCM4 (C); MCM5 (D); MCM6 (E); MCM7 (F). Expressions of MCM genes were upregulated in PDAC tumor tissues. *P<0.05.
Abbreviations: MCM, minichromosome maintenance; PAAD, pancreatic adenocarcinoma.
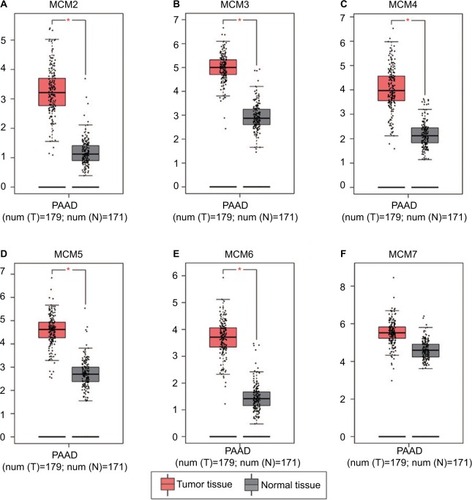
Figure 3 Expression distribution of MCM2–7 between PC tumor and normal tissues that was carried out by MERAV. Expressions of MCM genes were upregulated in PC tumor tissues.
Notes: Expression distribution box plot of MCM2 (A); MCM3 (B); MCM4 (C); MCM5 (D); MCM6 (E); MCM7 (F).
Abbreviations: MCM, minichromosome maintenance; MERAV, Metabolic gEne RApid Visualizer; PC, pancreatic cancer.
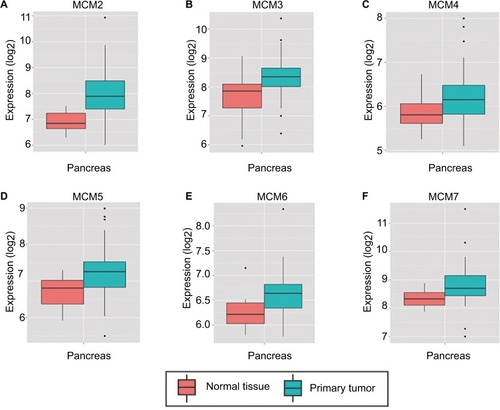
Figure 4 Coexpression matrix of MCM genes in PDAC tumor tissues and human normal pancreas tissues, and demonstrated that MCM2–7 were strongly positively correlation and coexpressed with each other in both PDAC tumor and normal pancreas tissues.
Notes: (A) Coexpression matrix of MCM genes in PDAC tumor tissues; (B) coexpression matrix of MCM genes in human normal pancreas tissues.
Abbreviations: MCM, minichromosome maintenance; PDAC, pancreatic ductal adenocarcinoma.
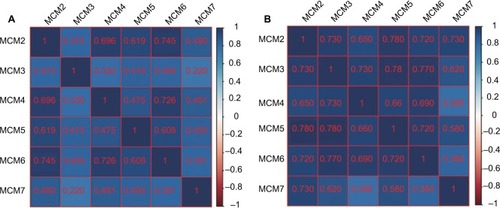
Figure 5 Gene expression distribution of MCM genes in different PDAC tumor stages and histologic grades, and ROC curves of MCM genes to distinguish different PDAC histologic grades.
Notes: (A) Gene expression distribution of MCM genes in different PDAC tumor stages; (B) gene expression distribution of MCM genes in different PDAC histologic grades; ROC curves of MCM2 (C), MCM4 (D), MCM7 (E) and MCM2 + MCM7 (F) combination to distinguish different PDAC histological grades. *P<0.05, **P<0.01.
Abbreviations: AUC, area under the curve; MCM, minichromosome maintenance; PDAC, pancreatic ductal adenocarcinoma; ROC, receiver operating characteristic.
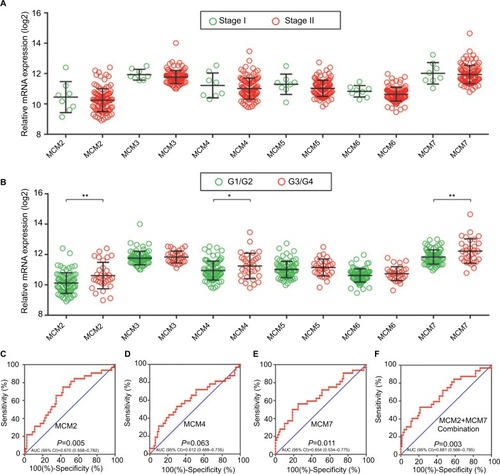
Table 1 Correlation between OS and clinicopathologic features of PDAC patientsTable Footnotea
Table 2 Prognostic values of MCM genes expression in PDAC OS of TCGA cohort
Figure 6 Kaplan–Meier survival curves for MCM genes in pancreatic ductal adenocarcinoma of The Cancer Genome Atlas cohort.
Notes: Overall survival stratified by MCM2 (A), MCM3 (B), MCM4 (C), MCM5 (D), MCM6 (E), and MCM7 (F).
Abbreviation: MCM, minichromosome maintenance.
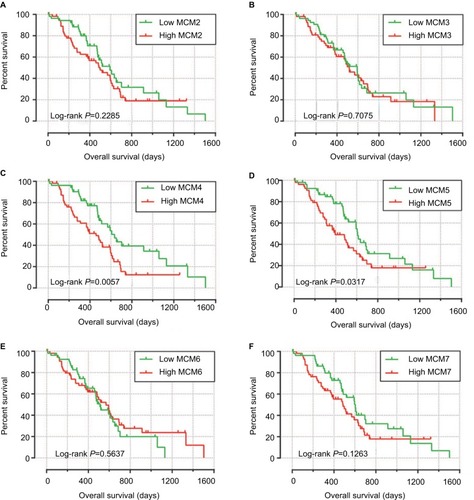
Figure 7 Prognostic value evaluation of MCM4 in patients with PDAC.
Notes: (A) From top to bottom are the expression values of MCM4, patients’ survival status distribution, and the expression heat map of MCM4 in the low- and high-expression groups. (B) Receiver operating characteristic curve for predicting overall survival in PDAC patients by the MCM4.
Abbreviations: MCM, minichromosome maintenance; PDAC, pancreatic ductal adenocarcinoma.
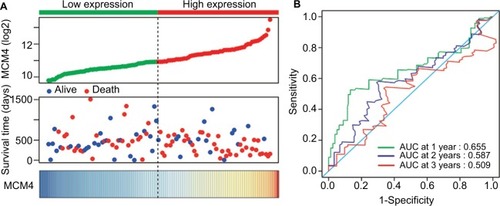
Table 3 Joint effects survival analysis of clinical factors and the MCM4 expression with OS in PDAC patients
Figure 8 The relationship between MCM4 and clinical information.
Notes: (A) Stratified analysis of association between MCM4 and overall survival in pancreatic ductal adenocarcinoma. (B) Nomogram for predicting the 1-, 2-, and 3-year event (death) with MCM4 and clinical information.
Abbreviation: MCM, minichromosome maintenance.
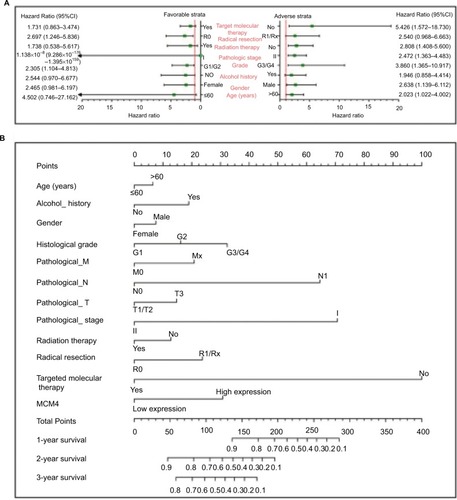
Figure 9 Joint effects analysis of overall survival stratified by MCM4 and pancreatic ductal adenocarcinoma clinical parameters.
Notes: Joint effects analysis stratified by MCM4 and following clinical parameters: Histologic grade (A), radiation therapy (B), radical resection (C), and targeted molecular therapy (D).
Abbreviation: MCM, minichromosome maintenance.
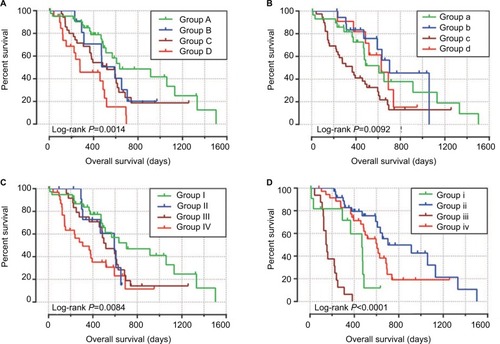
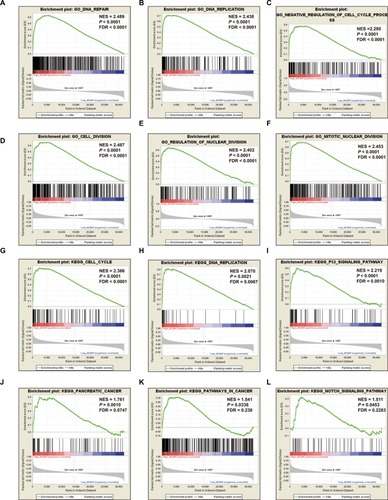
Figure 10 GSEA results of MCM4 in PDAC patients.
Notes: (A–F) GSEA results of c2 reference gene sets for high MCM4 expression groups; (G–L) GSEA results of c5 reference gene sets for high MCM4 expression groups.
Abbreviations: ES, enrichment score; FDR, false discovery rate; GSEA, gene set enrichment analysis; MCM, minichromosome maintenance; NES, normalized enrichment score; PDAC, pancreatic ductal adenocarcinoma.