Figures & data
Table 1 Four hundred ninety-seven DEGs were identified from GSE44076, including 129 upregulated genes and 368 downregulated genes in the colon cancer tissues compared to normal controls
Table 2 Top 20 hub genes with higher degree of connectivity
Figure 1 The protein–protein interaction network of top 20 hub genes.
Notes: The proteins encoded by the selected hub genes form the complex network by biochemical events and/or electrostatic forces. They may serve a distinct biological function as a complex in colon cancer progression.
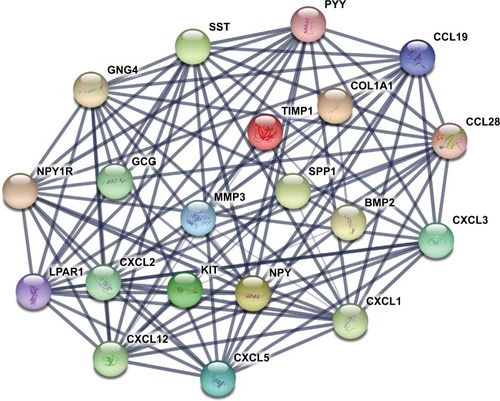
Figure 2 GO enrichment analysis results of DEGs in colon cancer.
Notes: (A) GO enrichment analysis results of upregulated DEGs in colon cancer. (B) GO enrichment analysis results of downregulated DEGs in colon cancer. The significant enriched GO terms of DEGs in colon cancer were based on their functions.
Abbreviations: DEGs, differentially expressed genes; GO, Gene Ontology.
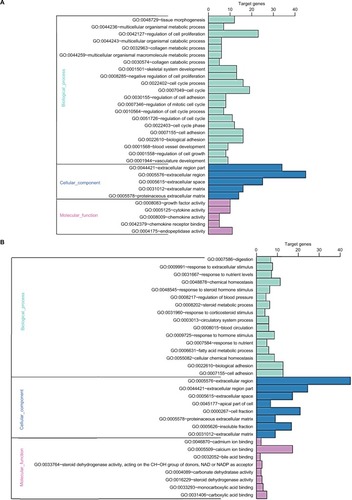
Table 3 KEGG pathway analysis of DEGs associated with colon cancer
Figure 3 Significantly enriched pathway terms of upregulated DEGs (A) and downregulated DEGs (B) in colon cancer.
Notes: DEGs functional and signaling pathway enrichment was performed using the online tools of KEGG pathway, Gene Ontology analysis, and Panther. P<0.05 was considered to have statistical significance and to achieve significant enrichment. The enrichment significance (-log10P) of different term is shown as different length and color of each bar (pathway).
Abbreviations: DEGs, differentially expressed genes; ECM, extracellular matrix; KEGG, Kyoto Encyclopedia of Genes and Genomes.
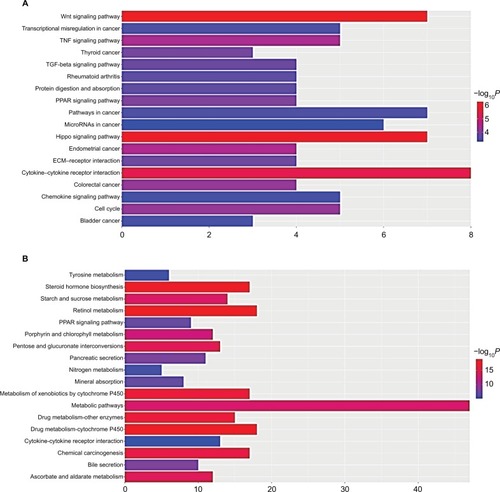
Figure 4 The top three modules from the protein–protein interaction network.
Notes: (A) Module 1; (B) the enriched pathways of module 1; (C) module 2; (D) the enriched pathways of module 2; (E) module 3; (F) the enriched pathways of module 3.
Abbreviation: FDR, false discovery rate.
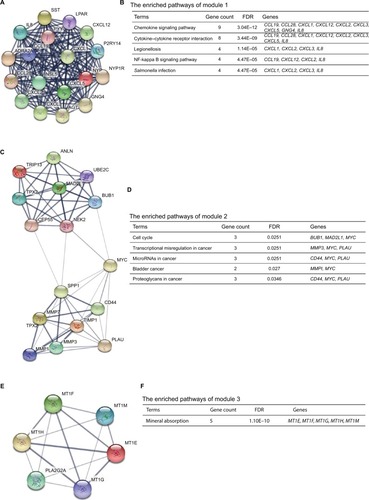
Figure 5 Prognostic values of six genes in colon cancer patients.
Notes: Prognostic values of (A) COL1A1, (B) CXCL5, (C) GNG4, (D) TIMP1, (E) SPP1, and (F) LPAR1 were obtained in the PROGgeneV2 – Pan Cancer Prognostics Database (www.compbio.iupui.edu/proggene) online software.
Abbreviation: OS, overall survival.
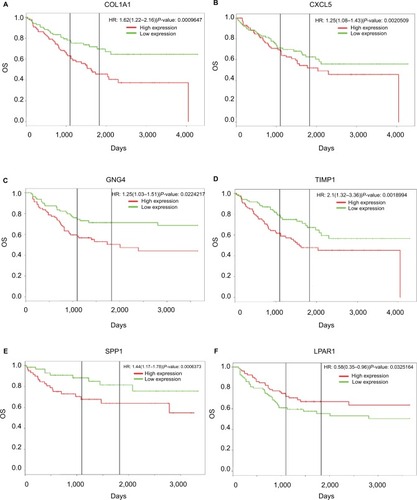
Figure 6 Regulatory networks of six DEGs under the regulations of non-coding RNAs.
Notes: The related lncRNAs and targeted miRNAs of six DEGs were predicted by the GCBI (http://www.gcbi.com.cn/). (A) Regulatory network of COL1A1; (B) regulatory network of CXCL5; (C) regulatory network of GNG4; (D) regulatory network of TIMP1; (E) regulatory network of SPP1; (F) regulatory network of LPAR1.
Abbreviations: DEGs, differentially expressed genes; GCBI, Gene-Cloud Biotechnology information.
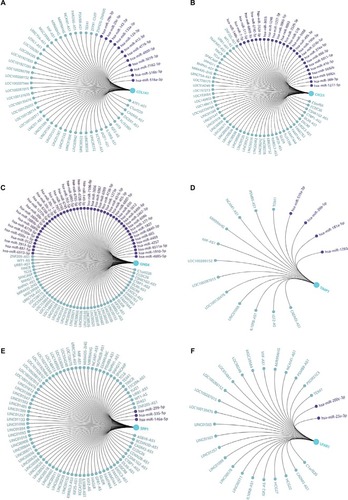
Figure S1 Expression levels of six DEGs in colon cancer tissues and normal tissues.
Abbreviations: DEGs, differentially expressed genes; GEPIA, Gene Expression Profiling Interactive Analysis.
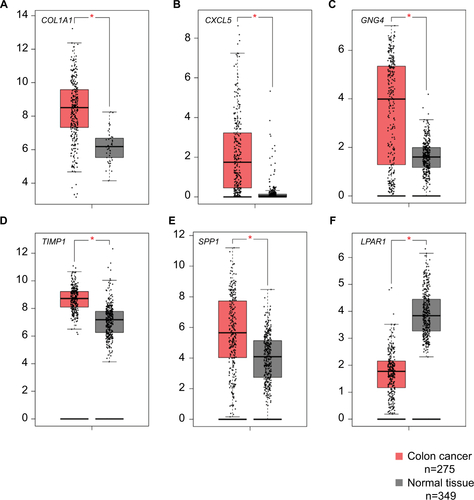
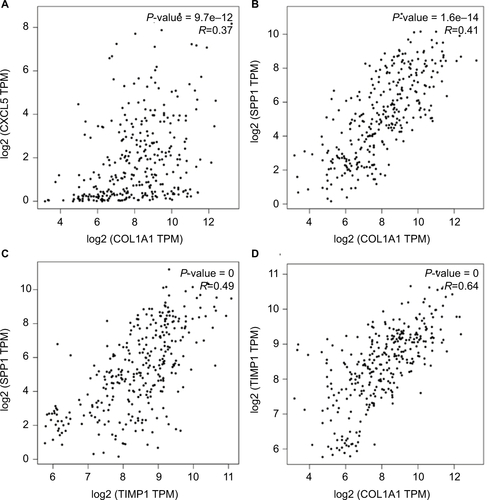
Figure S2 The correlation analysis among the hub genes.
Abbreviation: TPM, transcripts per million.