Figures & data
Table 1 Baseline characteristics of included studies
Figure 1 Flow chart of literature search and study selection.
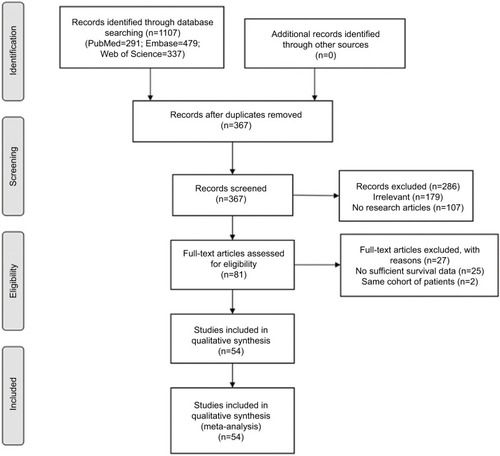
Figure 2 Forest plot of pooled HR and 95% CI of high ALP and OS prognosis.
Notes: (A) Observational cohorts; (B) RCTs.
Abbreviations: ALP, alkane phosphatase; OS, overall survival; RCT, randomized controlled trial; ES, effect size.
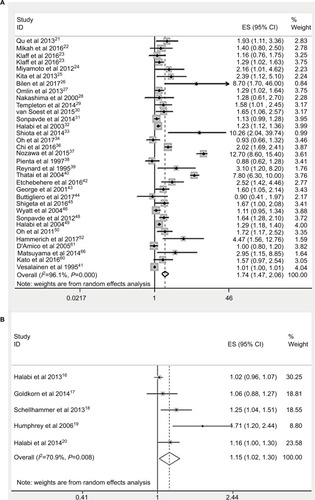
Figure 3 Forest plot of pooled HR of low ALP (A) or bone-specific ALP (B) and OS prognosis.
Abbreviations: ALP, alkane phosphatase; OS, overall survival; ES, effect size.
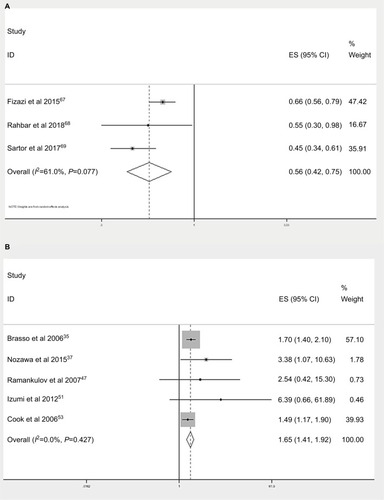
Figure 4 Forest plot of pooled HR and 95% CI of high ALP and CSS (A) or PFS (B) prognosis.
Abbreviations: ALP, alkane phosphatase; CSS, cancer-specific survival; PFS, progression-free survival; ES, effect size.
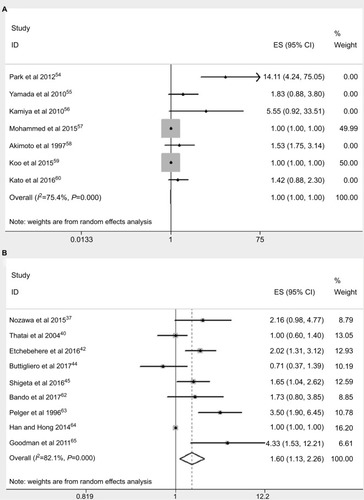
Table 2 Summary of the subgroup analysis results of ALP and OS prognosis for PCa
Figure 5 Sensitivity analyses of high ALP and OS prognosis.
Notes: (A) Observational cohorts; (B) RCTs.
Abbreviations: ALP, alkane phosphatase; OS, overall survival; RCT, randomized controlled trial.
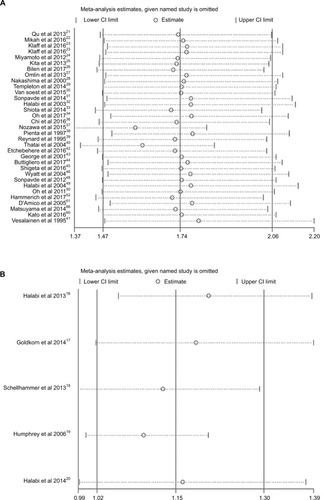
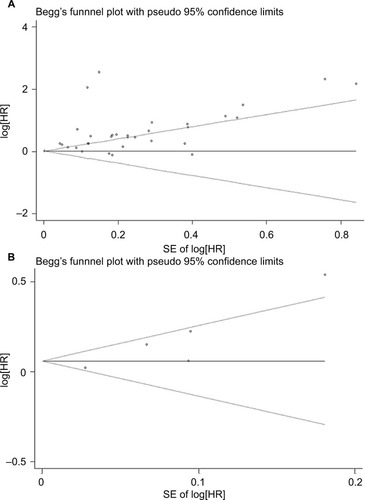
Figure 6 Funnel plots of Begg’s test of high ALP and OS prognosis.
Notes: (A) Observational cohorts; (B) RCTs.
Abbreviations: ALP, alkane phosphatase; OS, overall survival; RCT, randomized controlled trial.