
Figures & data
Table 1 Information for the SNPs genotyped in this study
Table 2 Clinicopathological characteristics and survival of TNBC
Table 3 AURKA or AURKB genotypes and DFS
Table 4 AURKA or AURKB genotypes and overall survival
Figure 1 Kaplan–Meier curve of OS for patients with different AURKA rs6099128 genotypes.
Abbreviation: OS, overall survival.
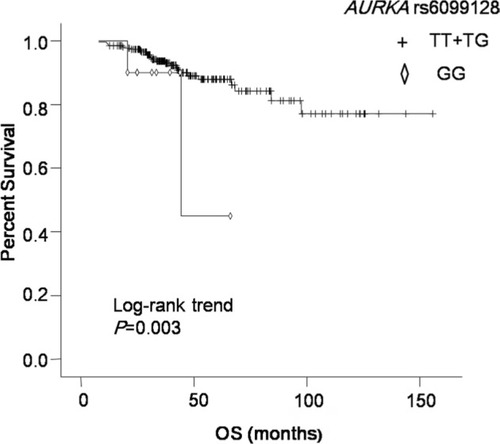
Figure 2 Kaplan–Meier curve of DFS for patients with different AURKB rs11651993 genotypes.
Abbreviation: DFS, disease-free survival.
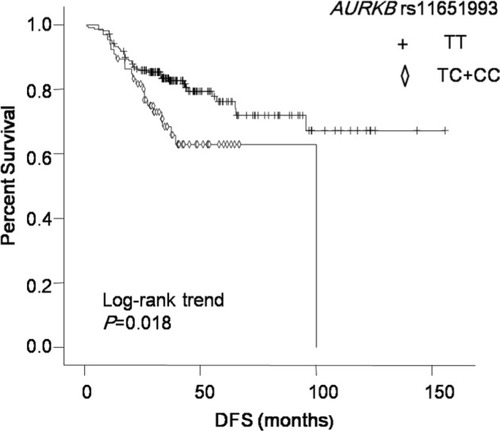
Figure 3 Kaplan–Meier curve of DFS for patients with different AURKB rs2289590 genotypes.
Abbreviation: DFS, disease-free survival.
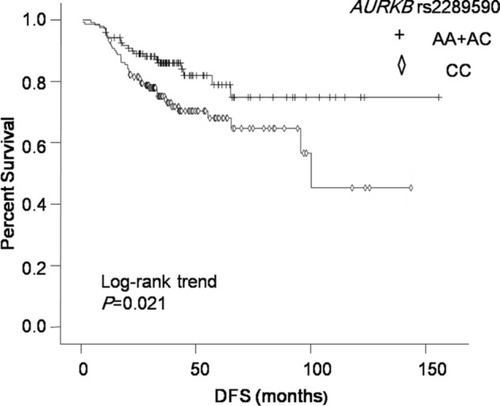
Table 5 Subgroup analysis of polymorphisms and survival