Figures & data
Figure 1 Inhibition of mTOR activity via everolimus treatment reduces the proliferation of skin SCC cells.
Notes: Cell viability of A431 (A) and HSC-1 (B) cells after 72-hour everolimus treatment at different dosages. Apoptosis analysis of A431 (C) and HSC-1 (D) by Annexin V/PI double staining after treatment with 100 nM everolimus for 72 hours. Everolimus-induced changes in mTOR activity in A431 (E) and HSC-1 (F) cells were analyzed by performing immunoblotting assays.
Abbreviations: SCC, squamous cell carcinoma; PI, propidium iodide.
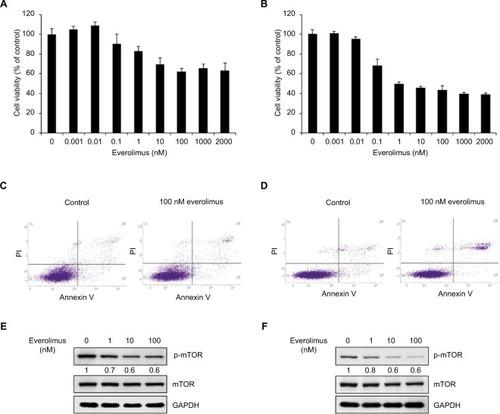
Figure 2 Identification of genes related to everolimus resistance in skin SCC cells using microarray analysis.
Notes: (A) Hierarchical clustering of the significant differences in gene expression for control and everolimus treatments in A431 and HSC-1 cells. (B) Venn diagram of the upregulated and downregulated genes after everolimus treatments. (C) GO enrichment analysis of the upregulated genes associated with everolimus resistance. (D) GO enrichment analysis of the downregulated genes associated with everolimus resistance.
Abbreviations: SCC, squamous cell carcinoma; GO, gene ontology.
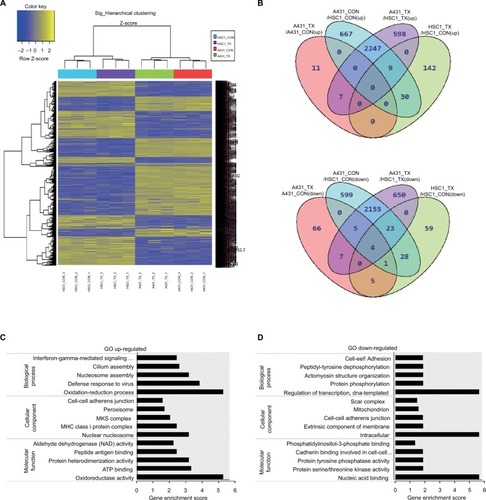
Figure 3 IPA of the genes associated with everolimus resistance.
Notes: (A) The functional pathway analysis network using IPA. (B) Validation of the DEG expression levels significantly involved in the pathway network using qRT-PCR analysis (*P<0.05 and **P<0.01). (C) Validation of the cyclin D1 using Western blot analysis.
Abbreviations: IPA, Ingenuity Pathway Analysis; DEG, differentially expressed gene; qRT-PCR, quantitative real-time PCR.
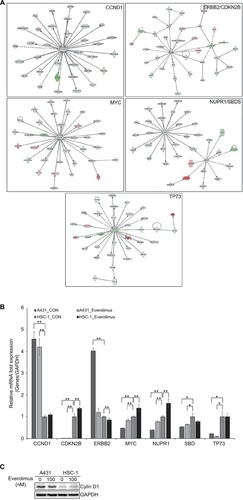
Figure 4 CCND1 overexpression induces everolimus resistance in HSC-1 cells.
Notes: (A) qRT-PCR analysis of exogenous CCND1 expression. (B) Cell viability in control and CCND1-overexpressing cells following treatment with 100 nM of everolimus.
Abbreviation: qRT-PCR, quantitative real-time PCR.
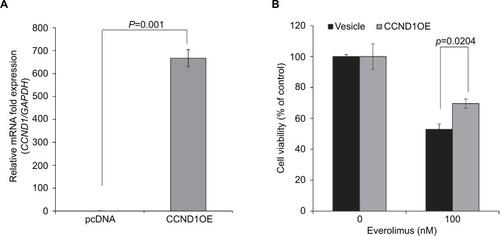
Figure S1 Inhibition of p70S6K activity via everolimus treatment in skin SCC cells.
Notes: Everolimus-induced changes in p70S6K activity in A431 (A) and HSC-1 (B) cells were analyzed by performing immunoblotting assays.
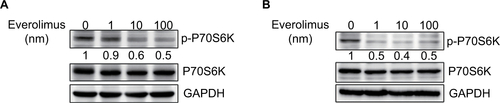
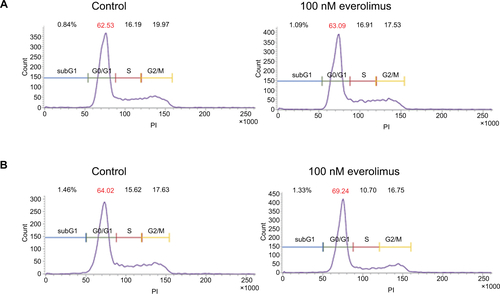
Figure S2 Cell cycle analysis using propididum iodide (PI) staining.
Notes: A431 (A) and HSC-1 (B) cells were treated with 100nM everolimus for 72h and were stained with PI. DNA content was measured with fluorescence activated cell sorting (FACS).