Figures & data
Figure 1 The study inclusion process.
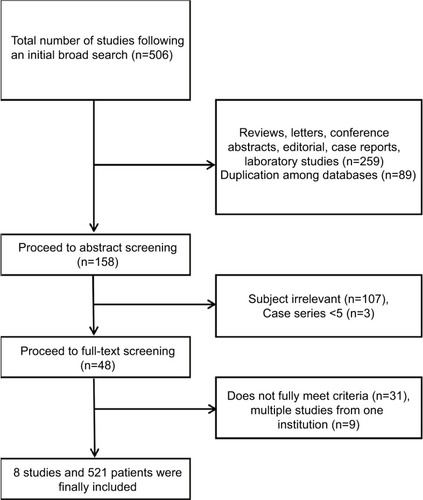
Table 1 Characteristics of the included studies
Table 2 Treatment profiles and clinical outcomes
Table 3 Pooled rates of main clinical outcomes
Figure 2 (A) Forest plots of the RRs and 1-year OS rates. The P-values from the Cochran Q testCitation21 and I2 statistics are described below the figures. Significant heterogeneity among the studies was found in regard to RRs, but not in 1-year OS rates. (B) Forest plots of RRs comparing high- and low-dose groups. The P-value was derived from a Q-test, based on an analysis of the variance and a random-effects model, where P (total between) <0.001 suggests a significant difference of RRs between high-dose and low-dose subgroups.
Abbreviations: OS, overall survival; RR, response rate.
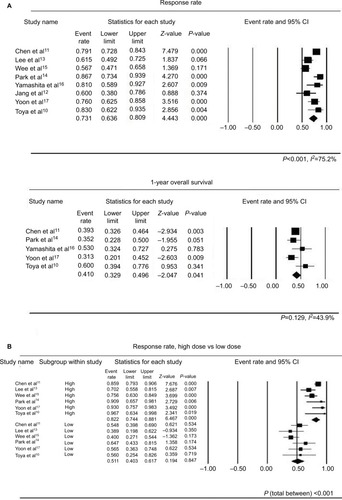
Figure 3 (A) Forest plot of GI toxicities of grade 3 or higher, (B) forest plot of thrombocytopenia of grade 3 or higher.
Abbreviations: CI, confidence interval; GI, gastrointestinal.
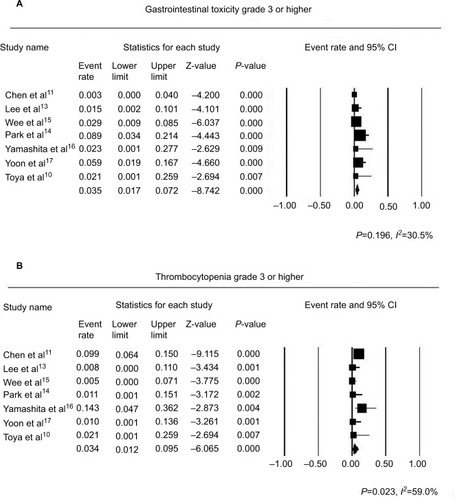
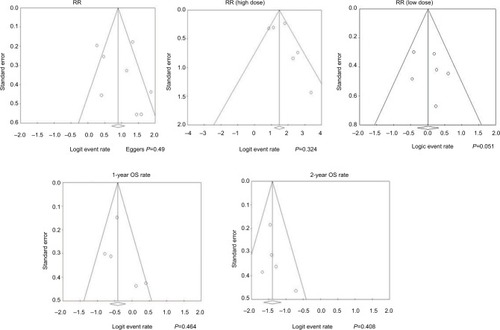
Figure 4 Funnel plots assessing RRs and OS rates.
Abbreviations: OS, overall survival; RR, response rate.