
Figures & data
Figure 1 Effects of WT1-AS on the migration and invasion in cervical cancer cell.
Notes: (A) Wound healing assay with SiHa and Ca-Ski cells. Microscopic observations were recorded 0 and 24 hours after scratching the cell surface. A representative image was shown (left panel). Histograms showed the percentage of wound closure (right panel). (B) Transwell assay. Photographs show cervical cancer cell that invaded through the Transwell membrane (upper panel). Histograms showed the numbers of invaded cell (lower panel). (C) Wound healing assay with SiHa and Ca-Ski cells. Microscopic observations were recorded 0 and 24 hours after scratching the cell surface. A representative image was shown (left panel). Histograms showed the percentage of wound closure (right panel). (D) Transwell assay. Photographs show cell that invaded through the membrane (upper panel). Histograms showed the numbers of invaded cell (lower panel). **P<0.01, compared to control.
Abbreviations: LV-WT1-AS, lentiviral vector encoding WT1-AS cDNA; sh-WT1-AS, shRNA targeting WT1-AS; WT1-AS, WT1 antisense RNA.
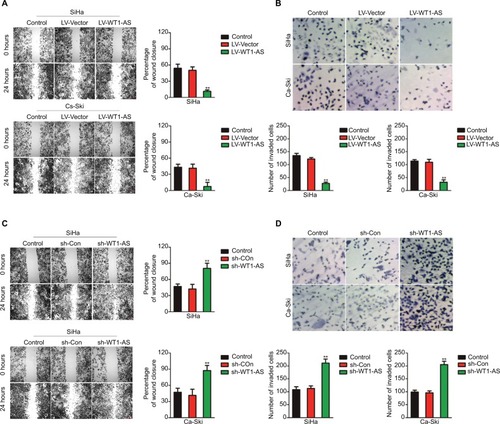
Figure 2 Effect of WT1-AS on the tumor growth of SiHa cell in vivo.
Notes: (A) SiHa cell was transfected with LV-WT1-AS and then was implanted into the nude mice. The tumor volume was measured each week. (B) Tumor weight. (C) Immunohistochemical staining of Ki-67 in tumor tissue. (D) SiHa cell was transfected with sh-Con or sh-WT1-AS and, then, was implanted into the nude mice. The tumor volume was measured each week, and the tumor volume was shown. (E) Tumor weight. (F) Immunohistochemical staining of Ki-67 in tumor tissue from sh-Con and sh-WT1-AS groups. (G) Metastatic lesions in the lungs of the models were shown at 6 weeks after tail vein. (H) Flow cytometry analysis of SiHa and Ca-Ski cells that were transfected with LV-WT1-AS or LV-Vector. **P<0.01, compared to control.
Abbreviations: LV-WT1-AS, lentiviral vector encoding WT1-AS cDNA; PI, propidium iodide; sh-WT1-AS, shRNA targeting WT1-AS; WT1-AS, WT1 antisense RNA.
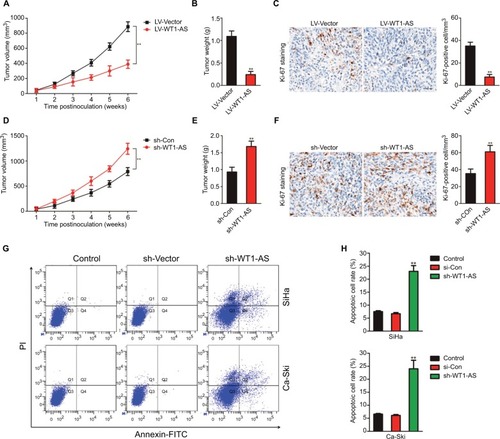
Figure 3 WT1-AS is the downstream target of miR-330-5p.
Notes: (A) The potential binding site was identified between WT1-AS and miR-330-5p. (B) Overexpression of WT1-AS inhibited the level of miR-330-5p in SiHa and Ca-Ski cells. (C) Cell was transfected with miR-NC or miR-330-5p, and the level of miR-330-5p was detected by qRT-PCR. (D) miR-330-5p transfection remarkably suppressed the level of WT1-AS in SiHa and Ca-Ski cells. **P<0.01, compared to control. (E) Luciferase reporter analysis suggested that WT1-AS directly targeted miR-330-5p. **P<0.01, compared to miR-MC + wt-WT1-AS. (F) Association between WT1-AS and miR-330-5p in cervical cancer tissue was evaluated. (G) miR-330-5p overexpressing promoted SiHa cell growth ability. Cell growth was measured by colony formation assay. (H) miR-330-5p overexpressing promoted cell invasion ability. Cell invasion was measured by Transwell invasion assay. (I) Downregulation of miR-330-5p inhibited SiHa cell colony formation. (J) Downexpression of miR-330-5p suppressed SiHa cell invasion in vitro. **P<0.01, compared to control.
Abbreviations: LV-WT1-AS, lentiviral vector encoding WT1-AS cDNA; qRT-PCR, quantitative real-time PCR; wt, wild-type; WT1-AS, WT1 antisense RNA.
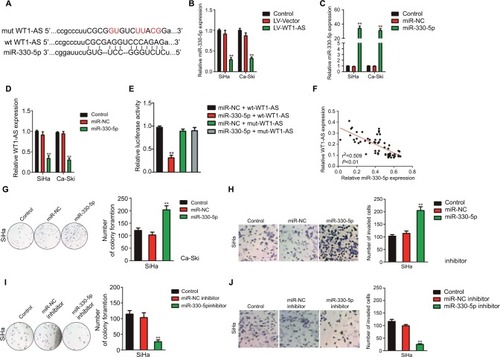
Figure 4 Regulation of cervical cancer cell colony formation and invasion by WT1-AS requires miR-330-5p.
Notes: (A) Total miRNAs was extracted from the paratumor and tumor tissues from patients with cervical cancer, and the level of miR-330-5p was determined by qRT-PCR assay. (B) The association between miR-330-5p expression and I or II–III tumor stage was shown. **P<0.01 compared to I. (C) Relative levels of miR-330-5p in metastatic and nonmetastatic cervical cancer tissues. **P<0.01 compared to nonmetastasis. (D) Overall survival analysis of cervical cancer patients with high or low level of miR-330-5p. (E) The levels of miR-330-5p in four cervical cancer cell lines and ECT1/E6E7 cell were detected by qRT-PCR analysis. **P<0.01 compared to ECT1/E6E7 cell. (F) Colony formation assay was performed in SiHa cell transfected with LV-WT1-AS, miR-330-5p, or LV-WT1-AS combination with miR-330-5p. (G) Transwell invasion assay was performed in SiHa cell transfected with LV-WT1-AS, miR-330-5p, or LV-WT1-AS combination with miR-330-5p. (H) Colony formation assay was conducted in SiHa cell transfected with sh-WT1-AS, miR-330-5p inhibitor, or sh-WT1-AS combination with miR-330-5p inhibitor. (I) Transwell invasion assay was conducted in SiHa cell transfected with sh-WT1-AS, miR-330-5p inhibitor, or sh-WT1-AS combination with miR-330-5p inhibitor. **P<0.01, compared to control. ##P<0.01, compared to LV-WT1-AS + miR-330-5p or sh-WT1-AS + miR-330-5p inhibitor.
Abbreviations: LV-WT1-AS, lentiviral vector encoding WT1-AS cDNA; qRT-PCR, quantitative real-time PCR; sh-WT1-AS, shRNA targeting WT1-AS; WT1-AS, WT1 antisense RNA.
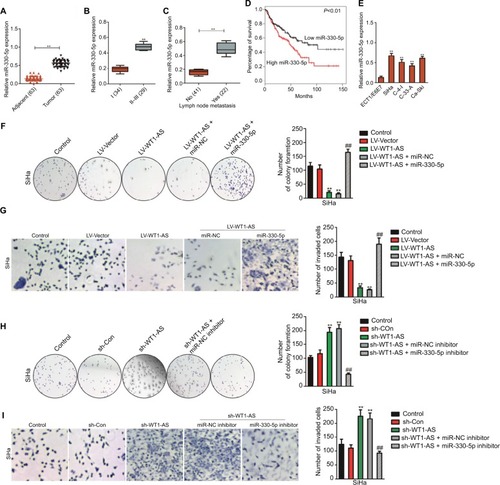
Figure 5 p53 is the directly target of miR-330-5p and associated with the progression of cervical cancer.
Notes: (A) Bioinformatics analysis revealed the putative binding sequences of miR-330-5p on p53 and the mutant sequences. (B) Luciferase activity was determined in HEK-293T cell co-transfected with miR-330-5p mimic and pMIR luciferase reporters containing p53-wt or p53-mut sequences. (C) miR-330-5p reduced the mRNA expression of p53 in SiHa and Ca-Ski cell. (D) miR-330-5p inhibited the expression of p53 in SiHa and Ca-Ski cell as shown in immunofluorescence analysis. (E) Total RNA was extracted from the paratumor and tumor tissues from patients with cervical cancer, and the mRNA level of p53 was determined by qRT-PCR assay. (F) Representative association between p53 expression and I or II–III tumor stage was shown. **P<0.01 compared to I. (G) Relative levels of p53 in metastatic and nonmetastatic cervical cancer tissues. **P<0.01 compared to nonmetastasis. (H) Overall survival analysis of cervical cancer patients with high or low level of p53. (I) The expression of p53 in peritumor and cervical cancer tissue was analyzed by immunohistochemical assay. (J) Association between p53 and miR-330-5p in cervical cancer tissue was evaluated. (K) The level of p53 in four cervical cancer cell lines and ECT1/E6E7 cell was detected by qRT-PCR analysis. **P<0.01 compared to ECT1/E6E7 cell.
Abbreviation: qRT-PCR, quantitative real-time PCR.
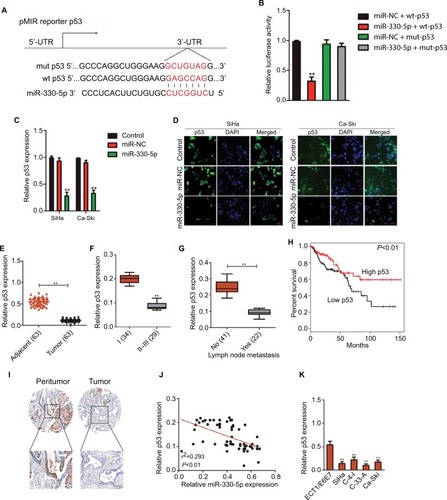
Figure 6 WT1-AS inhibits cervical cancer cell colony formation, migration, and invasion via regulation of miR-330-5p/p53 axis.
Notes: (A) The level of p53 was assayed in cell co-transfected with miR-330-5p alone or LV-WT1-AS combination with miR-330-5p. (B) Cell was co-transfected with sh-WT1-AS alone or sh-WT1-AS combination with LV-p53, and the level of p53 was determined by qRT-PCR analysis. (C) Cell was co-transfected with sh-WT1-AS alone or sh-WT1-AS combination with LV-p53, and colony formation assay was conducted. (D) Cell was co-transfected with sh-WT1-AS alone or sh-WT1-AS combination with LV-p53, and wound-healing assay was performed. (E) The invasion of transfected cell was determined by Transwell assay. (F) Schematic illustration of the positive feedback loop. WT1-AS upregulated p53 by binding to and suppressing miR-330-5p. **P<0.01 compared to sh-Con, ##P<0.01 compared to sh-WT1-AS + LV-Vector.
Abbreviations: LV-WT1-AS, lentiviral vector encoding WT1-AS cDNA; qRT-PCR, quantitative real-time PCR; sh-WT1-AS, shRNA targeting WT1-AS; WT1-AS, WT1 antisense RNA.
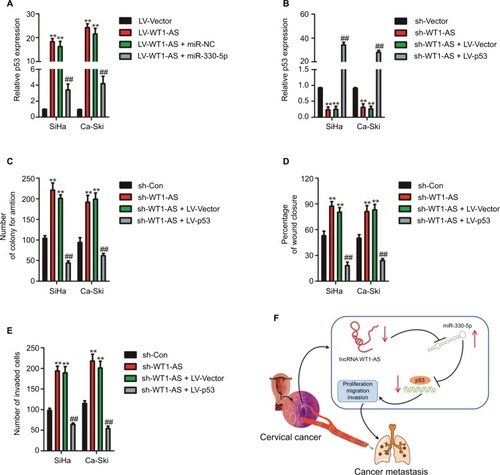
Figure S1 Cell was transfected with sh-Con or sh-WT1-AS and was plated into 96-well plates and cultured for 1, 2, 3, or 4 days.
Notes: MTT assay was performed, and the OD value was measured at 490 nm. **P<0.01 compared to control.
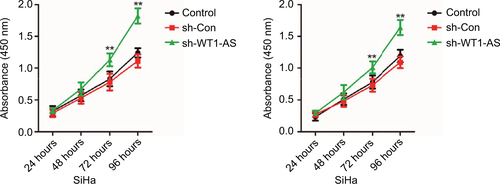
Figure S2 SiHa cell was transfected with miR-NC or miR-330-5p, and the expression of HPV E6 and HPV E7 were detected using Western blotting assay.
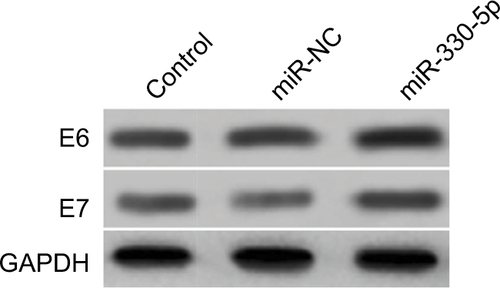
Figure S3 The mRNA level of p53 is significantly inhibited in cell that is transfeced with miR-330-5p.
Notes: (A and B) Venn graph represented the number of candidate common target genes determined by three bioinformatics analysis. (C) SiHa cell was transfected with miR-NC or miR-330-5p, and the levels of common target genes were detected using qRT-PCR assay. *P<0.05, **P<0.01 compared to control.
Abbreviation: qRT-PCR, quantitative real-time PCR.
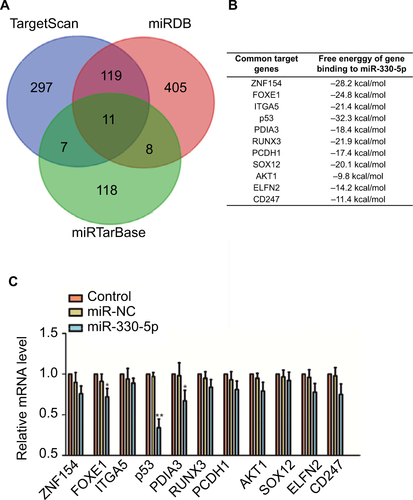
Figure S4 SiHa or Ca-Ski cell was transfected with sh-WT1-AS alone or cotransfected with sh-WT1-AS and miR-330-5p inhibitor.
Notes: The level of p53 was assayed using the qRT-PCR assay. **P<0.01 compared to sh-Con. ##P<0.01 compared to sh-WT1-AS + miR-NC inhibitor.
Abbreviation: qRT-PCR, quantitative real-time PCR.
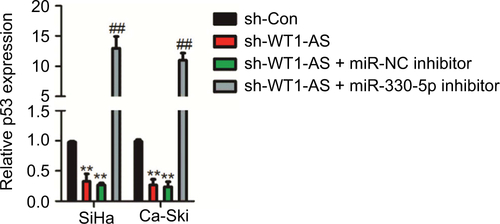
Table S1 The association between WT1-AS expression and clinicopathological factors in cervical cancer patients
Table S2 The association between miR-330-5p expression and clinicopathological factors in cervical cancer patients
Table S3 The association between p53 expression and clinicopathological factors in cervical cancer patients