Figures & data
Figure 1 Flowchart of study selection.
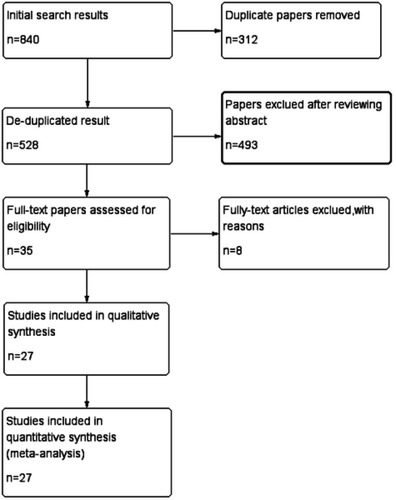
Table 1 Basic characteristics of 27 studies included in meta-analysis
Figure 2 Association between PD-L1 expression and (A1) tumor stage; (B1) tumor stage; (C) intravesical therapy of BCG; (D1) tumor grade; (E1) sex; (F1) smoking history; (G1) prior use of chemotherapy; (H1) lymph node metastases; and (I1) distant metastases in bladder cancer. Association between PD-L1 expression and (A2) tumor stage; (B2) tumor stage; (D2) tumor grade; (E2) sex; (F2) smoking history; (G2) prior use of chemotherapy; (H2) lymph node metastases; (I2) distant metastases; (J) recurrence; (K) death due to UTUC for patients with UTUC. Figure 2(A, C–K) expression of PD-L1 was defined by tumor cells. Figure 2(B) expression of PD-L1 was defined by tumor-infiltrating immune cells.
Abbreviations: PD-L1, programmed cell death-1; BCG, bacilli Calmette-Guerin; UTUC, upper urinary tract urothelial carcinoma; OR, odds ratio.
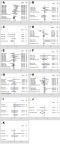
Figure 3 Forest plot to assess effect of PD-L1 tumor cell expression on (A1) OS for BC; (A2) OS for organ-confined BC, and (B1) CSS for BC; (B2) CSS for UTUC; (B3) CSS for organ-confined BC.
Abbreviations: PD-L1, programmed cell death ligand 1; OS, overall survival; BC, bladder cancer; CSS, cancer specific survival; UTUC, upper urinary tact urothelial carcinoma.
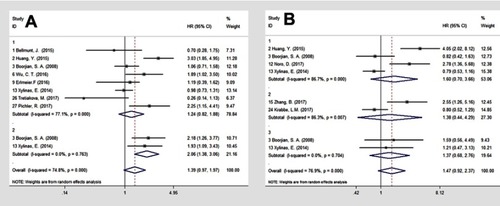
Figure 4 Forest plot of the combined overall survival (OS) for (A1) bladder cancer patients; (A2) patients with organ-confined BC; analyzed with multivariate analysis, with PD-L1 status defined by TCs and OS (B1) without and (B2) with anti-PD-1/PD-L1 treatment in urothelial carcinoma patients with PD-L1 status stratified by ICs.
Abbreviations: OS, overall survival; BC, bladder cancer; TCs, tumor cells; PD-L1, programmed cell death ligand 1; ICs, tumor-infiltrating immune cells.
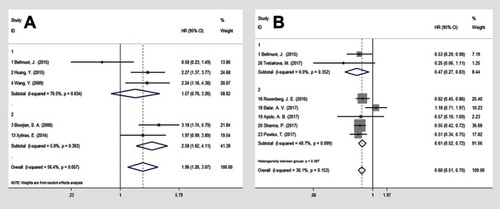
Figure 5 Forest plot of the combined overall response rate (ORR) of anti-PD-1/PD-L1 antibody treatment for UC with PD-L1 status defined by 1) TCs; 2) ICs; 3) CPS.
Abbreviations: ORR, overall response rate; PD-1/PD-L1, programmed cell death-1/programmed cell death ligand 1; UC, urothelial carcinoma; TCs, tumor cells; ICs, tumor-infiltrating immune cells; CPS, combined positive score.
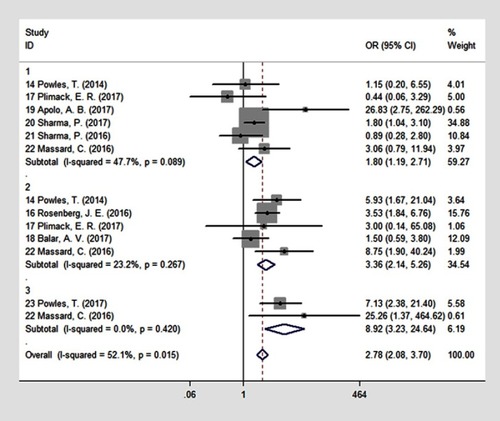
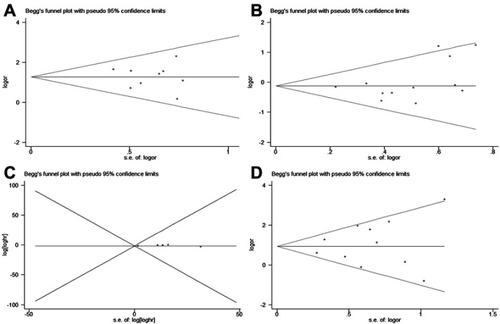
Figure 6 Funnel plot evaluating possible publication bias for (A) tumor stage; (B) sex; (C) OS; (D) ORR.
Abbreviations: OS, overall survival; ORR, objective response rate.