
Figures & data
Table 1 Characteristics of included studies
Figure 1 Flow diagram of study-selection process.
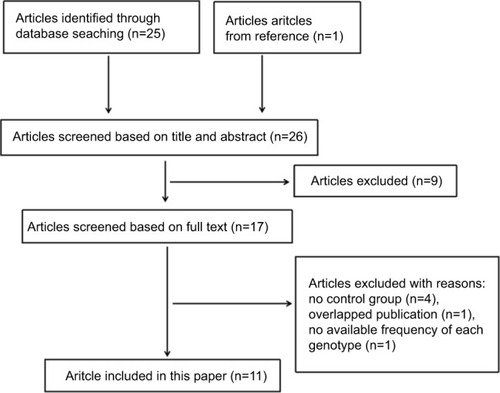
Table 2 Meta-analysis of association between MMP1 rs1799750 and prostate cancer
Figure 2 Forest plots of MMP1 rs1799750 and prostate cancer risk.
Notes: (A) Homozygote model; (B) heterozygote model; (C) dominant model; (D) recessive model; (E) additive model.
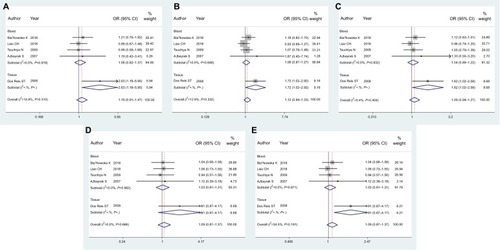
Table 3 Meta-analysis of association between MMP2 rs243865 and prostate cancer
Figure 3 Forest plots of MMP2 rs243865 and prostate cancer risk.
Notes: (A) Homozygote model; (B) heterozygote model; (C) dominant model; (D) recessive model; (E) additive model.
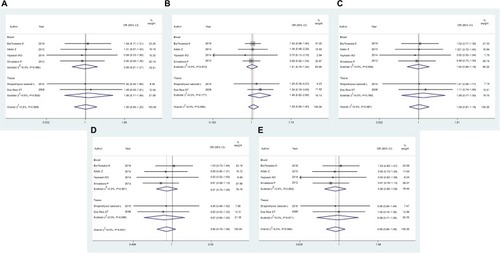
Table 4 Meta-analysis of association between MMP7 rs11568818 and prostate cancer
Figure 4 Forest plots of MMP7 rs11568818 and prostate cancer risk.
Notes: (A) Homozygote model; (B) heterozygote model; (C) dominant model; (D) recessive model; (E) additive model.
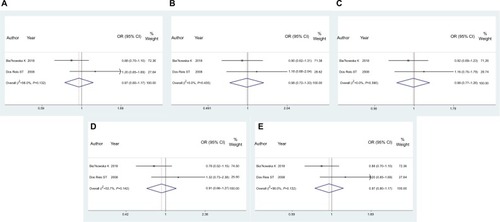
Figure 5 Funnel plots of MMP1 rs1799750 and prostate cancer risk.
Notes: (A) Homozygote model; (B) heterozygote model; (C) dominant model; (D) recessive model; (E) additive model.
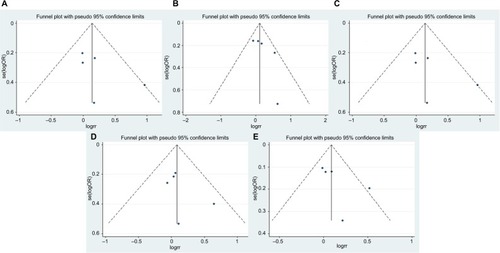
Figure 6 Funnel plots of MMP2 rs243865 and prostate cancer risk.
Notes: (A) Homozygote model; (B) heterozygote model; (C) dominant model; (D) recessive model; (E) additive model.
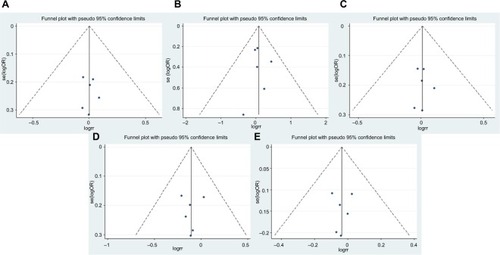
Table 5 Systematic review of association between MMPs polymorphisms and prostate cancer
Table S1 PRISMA checklist
Table S2 Quality-assessment scores
Table S3 Definition of comparison models
Table S4 Frequency of genotype in studies from meta-analysis. (A) MMP1 rs1799750; (B) MMP2 rs243865; (C) MMP7 rs11568818
Table S5 Frequency of genotype in studies from systematic review