Figures & data
Table 1 Overview of clinical parameters and expression of Smurf2
Figure 1 Transcript expression levels of Smurf2 in colorectal cancer tissue and corresponding healthy mucosa (n=98).
Notes: Smurf2 was significantly overexpressed in colorectal cancer specimens compared to corresponding healthy mucosa. Bars represent mean + SEM. **P=0.003.
Abbreviation: SEM, standard error of the mean.
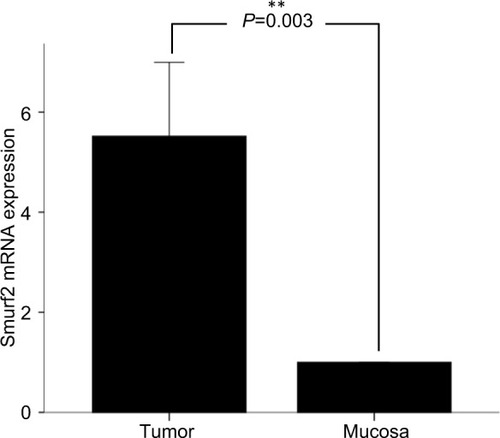
Figure 2 (A) Smurf2 expression dependent on patients’ microsatellite status. Patients with microsatellite stable (MSS) tumors (n=58) displayed a significantly lower expression of Smurf2 than patients with microsatellite instable (MSI) tumors (n=11; P=0.006). (B) Within the 58 MSS tumors, Smurf2 expression was significantly higher in M1 staged patients vs M0 (P=0.024).
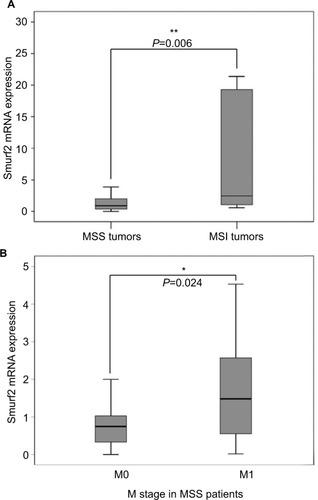
Figure 3 Representative immunohistochemistry revealing spatial localization of Smurf2 protein (40 × magnification).
Notes: Smurf2 was strongly expressed in the tumor cells (A), particularly in the cytoplasm (arrowheads), whereas healthy mucosa cells (B) only showed a very weak expression of Smurf 2.
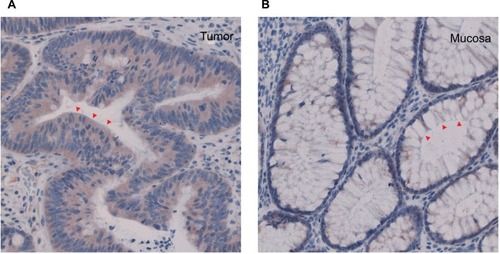
Figure 4 (A) Correlation of Smurf2 expression and overall survival of the entire patient cohort revealed no significant difference between Smurf2 high and Smurf2 low tumors (n=98) (P=0.86). (B) Correlation of Smurf2 with microsatellite status and overall survival. Overall survival was significantly impaired in microsatellite stable (MSS) patients expressing high levels of Smurf2 (n=58) (*P=0.044).
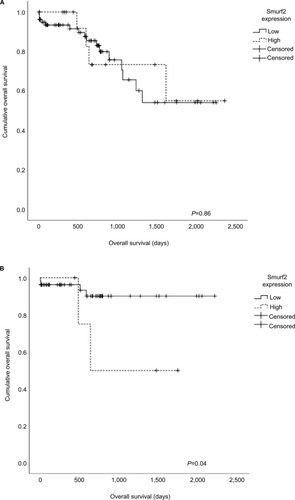
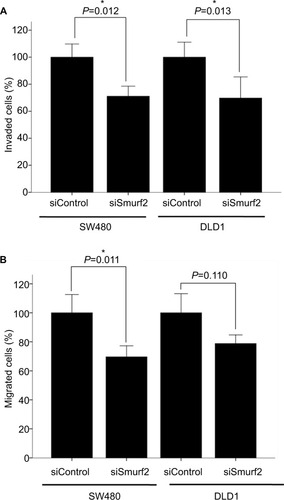
Figure 5 Invasion (A) and migration (B) assays.
Notes: Smurf2 siRNA-transfected SW-480 cells were both significantly less invasive (*P=0.012) and migrative (*P=0.011); DLD-1 cells revealed significantly reduced invasive potential (*P=0.013). Bars represent mean + SEM.
Abbreviation: SEM, standard error of the mean.