
Figures & data
Table 1 Main characteristics of eligible studies in the meta-analysis
Figure 1 Flow diagram of the meta-analysis.
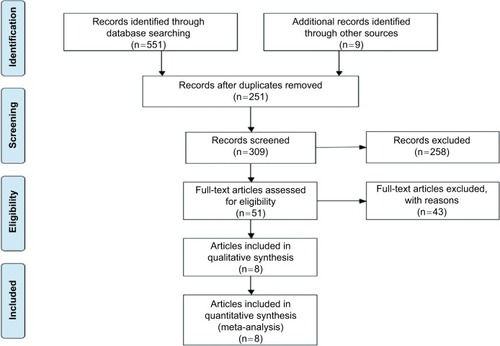
Figure 2 Meta-analysis of the relationship between AGR and OS.
Abbreviations: AGR, albumin-to-globulin ratio; BC, bladder carcinoma; OS, overall survival; RCC, renal cell carcinoma; UTCC, upper tract urothelial carcinoma.
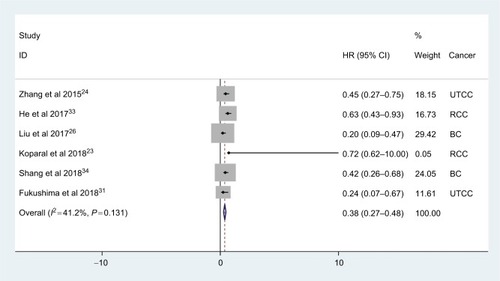
Table 2 Subgroup analysis of the association between AGR and OS
Figure 3 Meta-analysis of the relationship between AGR and CSS.
Abbreviations: AGR, albumin-to-globulin ratio; BC, bladder carcinoma; CSS, cancer-specific survival; UTCC, upper tract urothelial carcinoma.
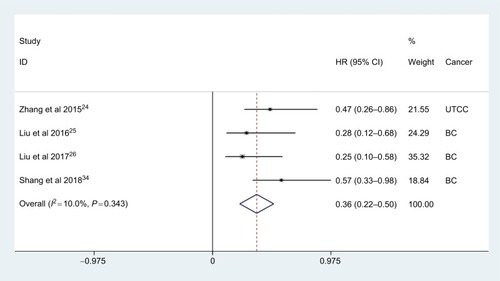
Figure 4 Meta-analysis of the relationship between AGR and EFS.
Abbreviations: AGR, albumin-to-globulin ratio; DFS, disease-free survival; EFS, event-free survival; PFS, progression-free survival; RFS, recurrence-free survival.
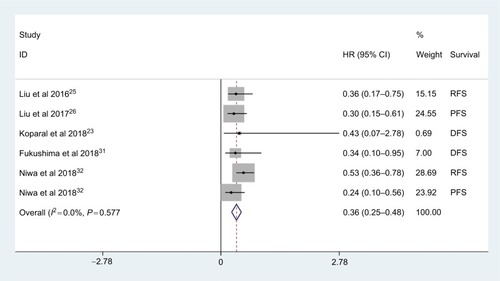
Figure 5 Meta-analysis of the association between AGR and tumor grade.
Abbreviation: AGR, albumin-to-globulin ratio.
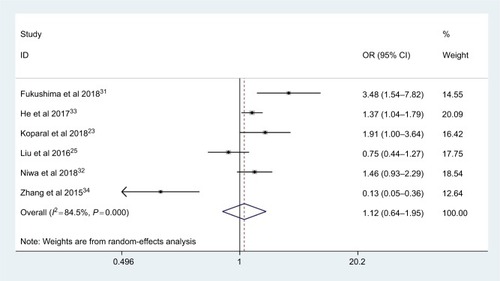
Figure 6 Meta-analysis of the association between AGR and lymphovascular invasion.
Abbreviation: AGR, albumin-to-globulin ratio.
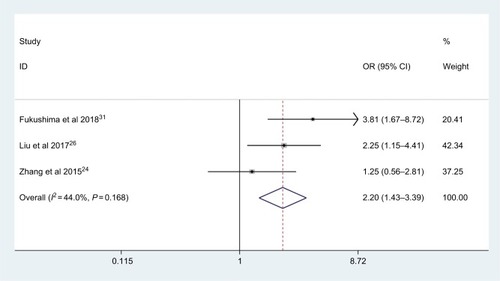
Figure 7 Meta-analysis of the association between AGR and pT status.
Abbreviation: AGR, albumin-to-globulin ratio.
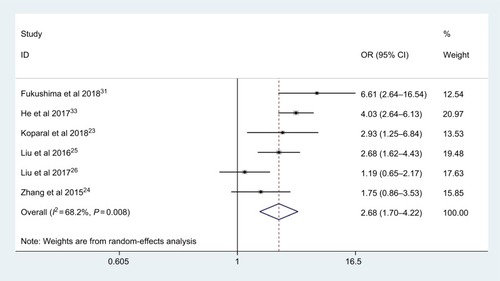
Figure 8 Meta-analysis of the association between AGR and pN status.
Abbreviation: AGR, albumin-to-globulin ratio.
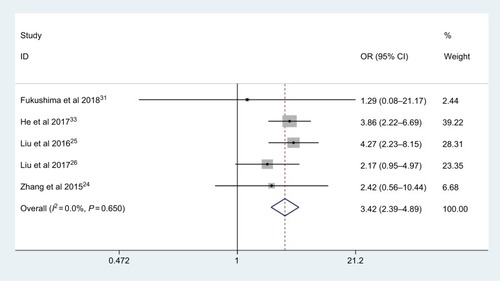
Figure 9 Publication bias assessment for OS (A), CSS (B), EFS (C), tumor grade (D), LVI (E), pT (F) and pN (G).
Abbreviations: CSS, cancer-specific survival; EFS, event-free survival; LVI, lymphovascular invasion; OS, overall survival.
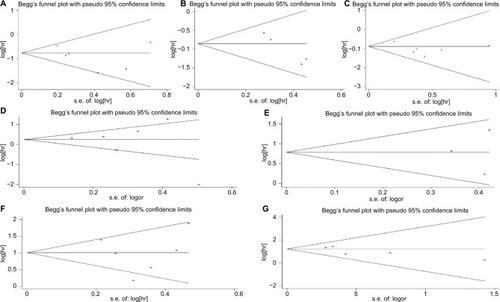
Figure 10 Sensitivity analysis for OS (A), CSS (B), EFS (C), tumor grade (D), LVI (E), pT (F) and pN (G).
Abbreviations: CSS, cancer-specific survival; EFS, event-free survival; LVI, lymphovascular invasion; OS, overall survival.
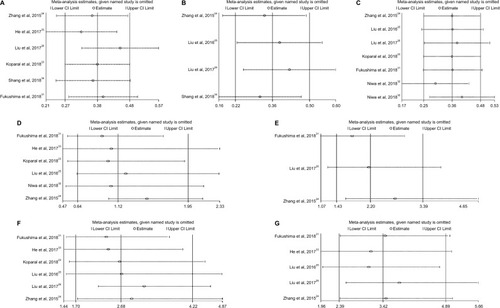
Table S1 Relevant data for AGR and clinicopathologic features