Figures & data
Figure 1 Flowchart of the selection of the studies in the meta-analysis.
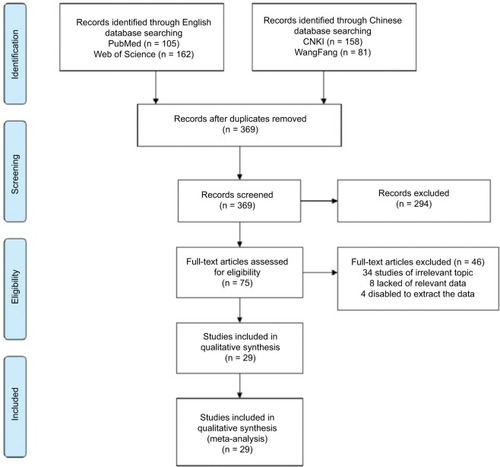
Table 1 Main characteristics of all studies included in the meta-analysis
Table 2 Main meta-analysis results for OS
Figure 2 Forest plot of hazard ratio for the association of HE4 expression and overall survival.
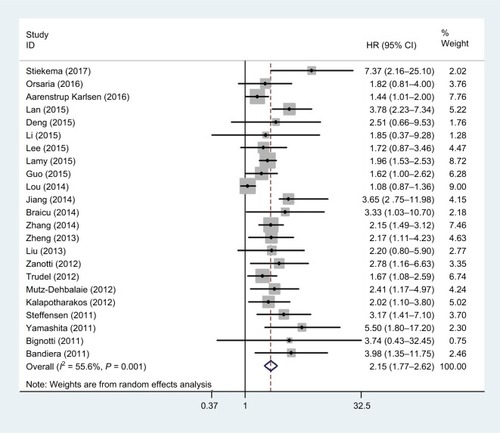
Figure 3 Sensitivity analysis of pooled HRs on the association between HE4 expression and overall survival.
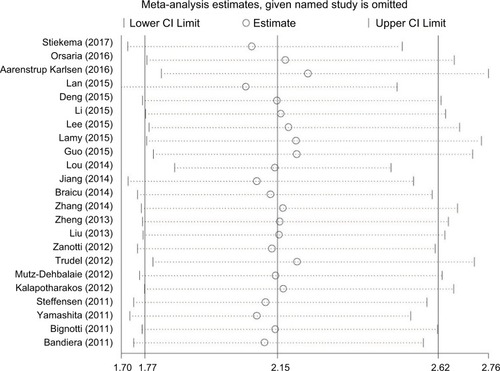
Figure 4 Forest plot of hazard ratio for the association of HE4 expression and disease-free survival.
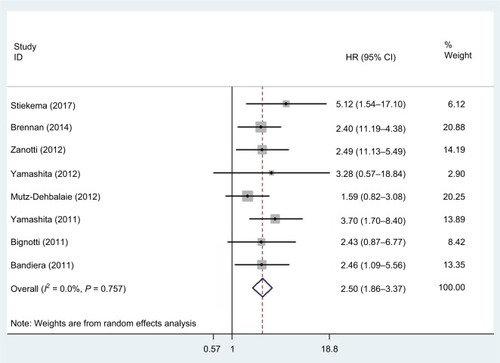
Figure 5 Forest plot of hazard ratio for the association of HE4 expression and progression-free survival.
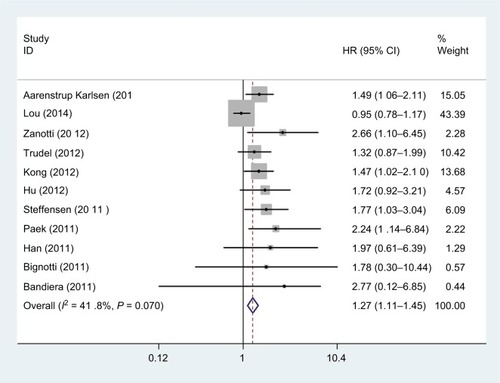
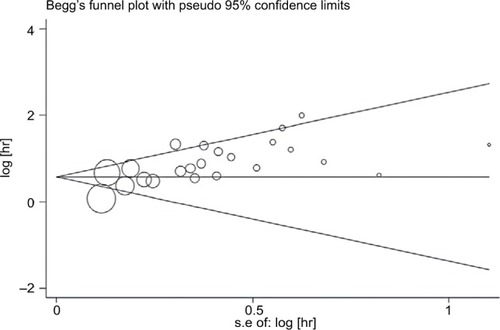
Figure 6 Funnel plots of publication bias for all of the included studies reported with overall survival.