
Figures & data
Table 1 HRQoL instruments used in the study.
Table 2 Baseline clinical and laboratory characteristics of HCC patients.
Table 3 Health-related QoL characteristics of the 455 HCC patients based on EORTC QLQ-C30 and EORTC QLQ-HCC18 assessment
Figure 1 Scatter plot of C30 index scores against log IL-8 levels of the 455 HCC patients.
Abbreviation: HCC, hepatocellular carcinoma.
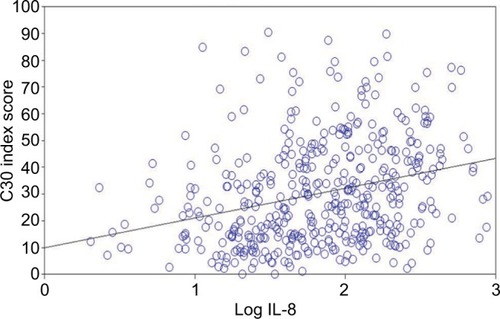
Figure 2 Scatter plot of HCC18 index scores against log IL-8 levels of the 455 HCC patients.
Abbreviation: HCC, hepatocellular carcinoma.
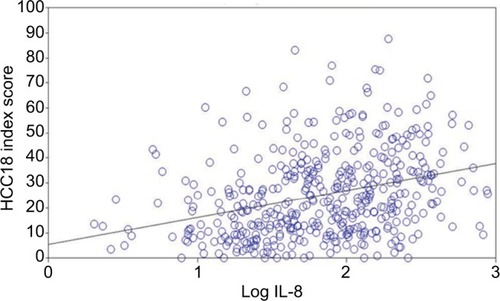
Table 4 Pearson’s correlation analyses between log IL-8 and HRQoL variables.
Table 5 Student’s t-test for HRQoL scores according to mIBI scores 0–1 vs 2–3.
Table S1 Univariate logistic regressions of HRQoL variables for log IL-8 ≥1.8
Table S2 Multiple logistic regressions of HRQoL variables for log IL-8 ≥1.8
Table S3 Univariate logistic regressions of HRQoL variables for mIBI 2–3
Table S4 Multiple logistic regressions of HRQoL variables for mIBI 2–3