
Figures & data
Figure 1 Tumor growth effect of a 6-week treatment with MTX and/or castration.
Notes: (A) Antitumor activities of different concentrations of MTX (control, 0.35, 1, and 3.5 mg/kg) in PCa xenograft mouse models. (B) Combined effects of androgen deprivation and MTX on PCa xenograft growth (P<0.015) (n=5 mice per group).
Abbreviations: MTX, mitoxantrone; PCa, prostate cancer; wk, Week.
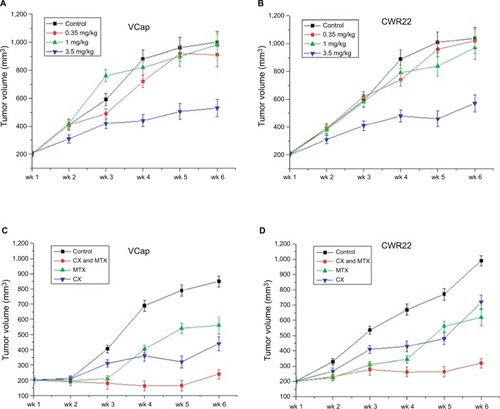
Table 1 Top ten up- and downexpressed genes in xenograft of VCaP vs its parent cells
Table 2 Top ten up- and downexpressed genes in xenograft of CWR22R vs its parent cells
Figure 2 Detection of EPHA4, AKR1C3, HIF1A, and HSD17B12 expression.
Notes: Expression data from VCaPR and CWR22R PCa xenografts from castrated, MTX-treated mice, and parental cell lines were assessed by Western blot (A) and qRT-PCR (B). EPHA4, AKR1C3, and HSD17B12 expression was significantly increased, whereas HIF1A expression was dramatically lower in the MTX-treatment xenografts compared to their parental cell lines (P<0.01).
Abbreviations: qRT-PCR, quantitative reverse transcription PCR; MTX, mitoxantrone; PCa, prostate cancer.
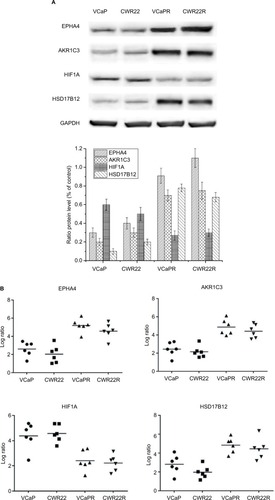
Figure 3 qRT-PCR analysis of DEGs identified in the microarray.
Notes: Comparison of DEGs between PCa xenografts from castrated mice and parental cell lines. (A) CWR22R vs CWR22. (B) VCaPR vs VCaP. Expression data are represented by a log ratio calculated by comparing ΔCq from the xenograft with ΔCq from the parent cells. ΔCq was calculated as the difference between Cq of the targeted genes and Cq of the endogenous control gene, β-actin. Using this method, 16/18 (89%) genes pulled from the microarray analysis were confirmed to be differentially expressed by qRT-PCR.
Abbreviations: DEGs, differentially expressed genes; qRT-PCR, quantitative reverse transcription PCR; PCa, prostate cancer.
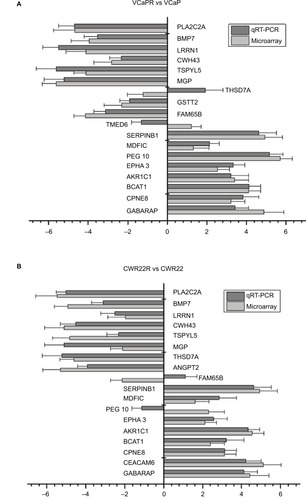
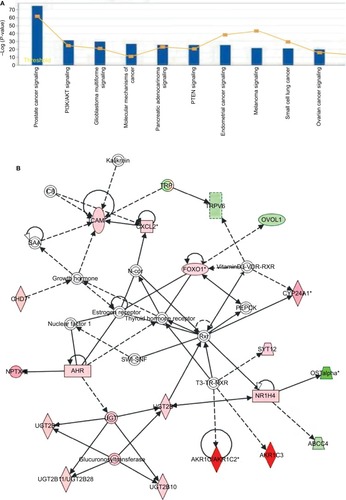
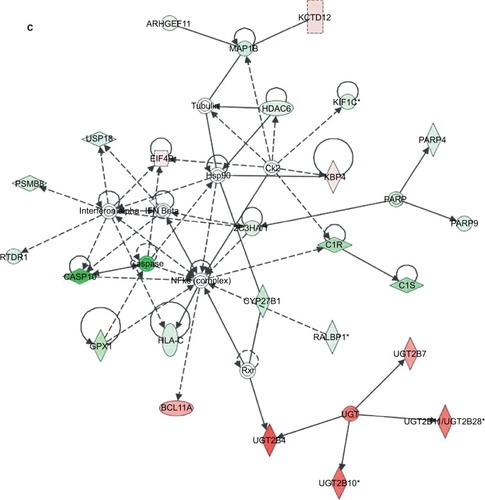
Figure 4 Pathway function enrichment and deregulated gene networks.
Notes: Representation of canonical pathways across the entire dataset; y-axis displays the significance. For ratios, taller bars indicate more genes associated with the canonical pathway (A). Deregulated gene networks in MTX-treatment xenografts (B and C). Red and green intensities indicate the degree of upregulation and downregulation, respectively. Genes in uncolored notes were not identified as differentially expressed and were integrated into the computationally generated networks based on evidence stored in the IPA knowledge memory, indicating a relevance to this network.
Abbreviations: IPA, Ingenuity Pathway Analysis; MTX, mitoxantrone.
Data availability
The data of the study have been deposited into the Research Data Deposit (http://www.researchdata.org.cn with the Approval Number asRDDB2018000383).