
Figures & data
Table 1 Clinicopathological data of patients with HCC who underwent different fraction doses of hypofractionated 3DCRT
Table 2 Mean values of dosimetric parameters in patients
Figure 1 Overall survival curves of the entire patient population who underwent different fraction doses of hypofractionated three-dimensional conformal radiotherapy (P=0.009).
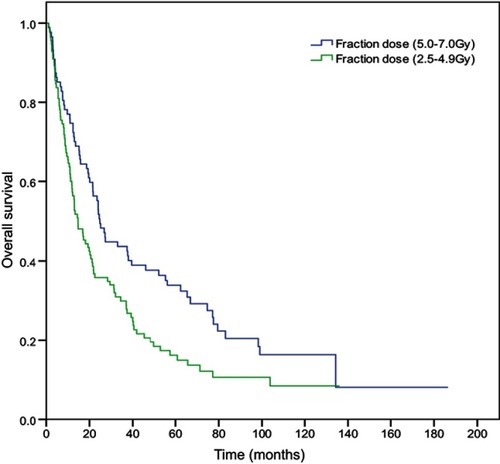
Table 3 Characteristics for hepatocellular carcinoma recurrence
Table 4 Multivariate analysis of clinicopathological factors predictive of poor overall survival
Figure 2 Overall survival curves of the propensity score-matched patient population who underwent different fraction doses of hypofractionated three-dimensional conformal radiotherapy (P=0.041).
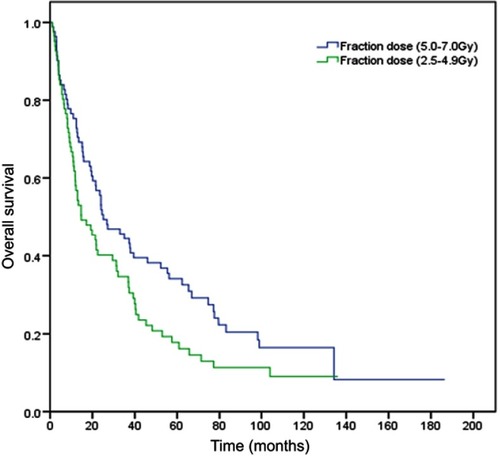
Table 5 Complications after treatment