Figures & data
Figure 1 Schematic flow diagram for selection of included studies.
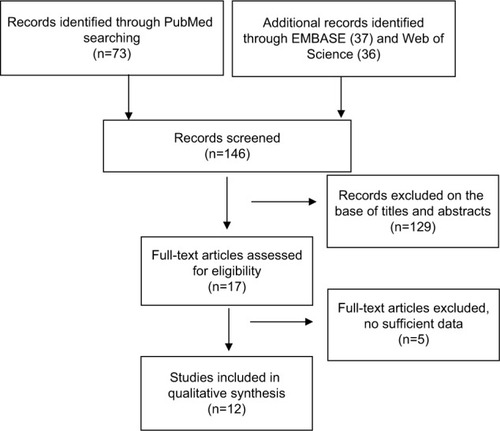
Table 1 Main characteristics of included studies
Figure 2 Forest plot for CDH1 promoter hypermethylation in HCC and normal liver tissue.
Notes: The squares represent the weight of individual study in the meta-analysis and the line width indicates the corresponding 95% CI. The diamond represents the pooled OR and the width of diamond indicates 95% CI.
Abbreviations: HCC, hepatocellular carcinoma; NLT, normal liver tissue; M–H, Mantel–Haenszel.
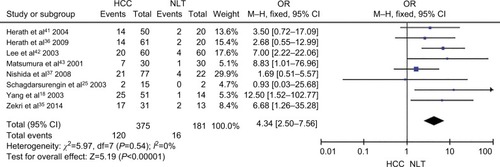
Figure 3 Forest plot for CDH1 promoter hypermethylation in HCC and CLD.
Notes: The squares represent the weight of individual study in the meta-analysis and the line width indicates the corresponding 95% CI. The diamond represents the pooled OR and the width of diamond indicates 95% CI.
Abbreviations: CLD, chronic liver disease; HCC, hepatocellular carcinoma; M–H, Mantel–Haenszel.
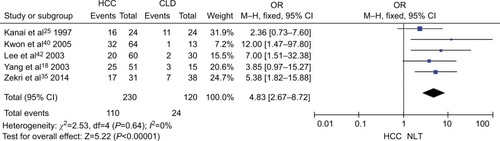
Figure 4 Forest plot for CDH1 promoter hypermethylation in high and low grade of histological differentiation.
Notes: The squares represent the weight of individual study in the meta-analysis and the line width indicates the corresponding 95% CI. The diamond represents the pooled OR and the width of diamond indicates 95% CI.
Abbreviation: M–H, Mantel–Haenszel.
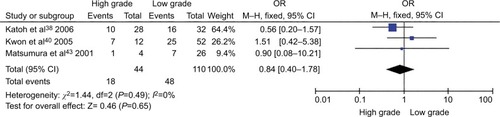
Figure 5 Forest plot for CDH1 promoter hypermethylation in different stage of HCC.
Notes: The squares represent the weight of individual study in the meta-analysis and the line width indicates the corresponding 95% CI. The diamond represents the pooled OR and the width of diamond indicates 95% CI.
Abbreviations: HCC, hepatocellular carcinoma; M–H, Mantel–Haenszel.
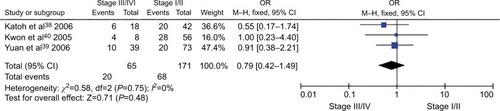
Figure 6 Comparison of overall survival between patients with high and low expression of CDH1 mRNA.
Abbreviation: HR, hazard ratio.
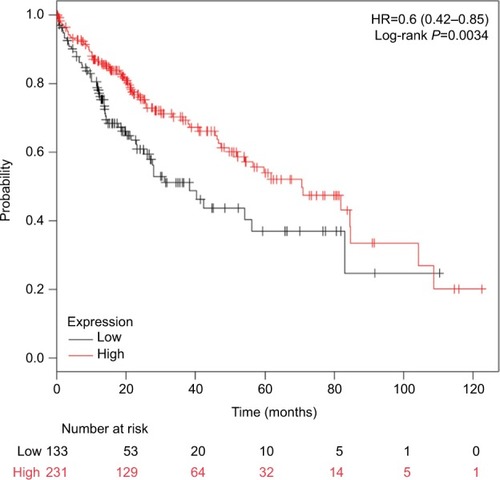
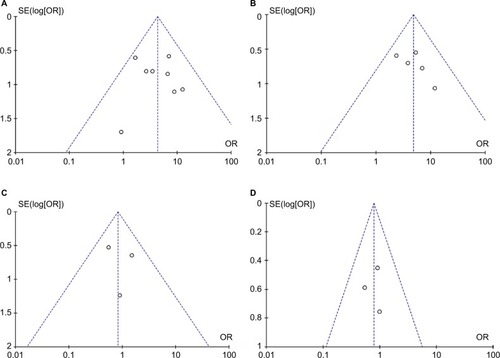
Figure 7 Funnel plot for publication bias.
Notes: (A) CDH1 promoter hypermethylation in HCC and normal liver tissue; (B) CDH1 promoter hypermethylation in HCC and CLD; (C) CDH1 promoter hypermethylation in high and low grade of histological differentiation; (D) CDH1 promoter hypermethylation in different stage of HCC. Area of the circle represents the weight of individual study.
Abbreviations: CLD, chronic liver disease; HCC, hepatocellular carcinoma; SE, standard error.