Figures & data
Figure 1 DR7 can be detected in the glioma tissues and primary cultured human glioma cells.
Notes: (A) IHC staining of DR7 in the 27 glioma and 30 normal brain tissues. DR7 is mainly expressed in the cytoplasm. Representative images were obtained at 200× magnification. *P<0.05. (B) DR7 expression was validated by RT-PCR in the eleven glioma tissues with positive IHC staining of DR7 and eleven normal brain tissues with negative IHC staining of DR7. (C) IF staining of DR7 in the primary cultured human glioma cells. The glioma cells were isolated from human astrocytoma. Upper panel, the primary cultured glioma cells with positive DR7 expression; lower panel, the primary cultured glioma cells with negative DR7 expression. Representative images were obtained at 200× magnification.
Abbreviations: DR7, direct repeat 7; IF, immunofluorescence; IHC, immunohistochemistry; RT-PCR, reverse transcriptase-PCR.
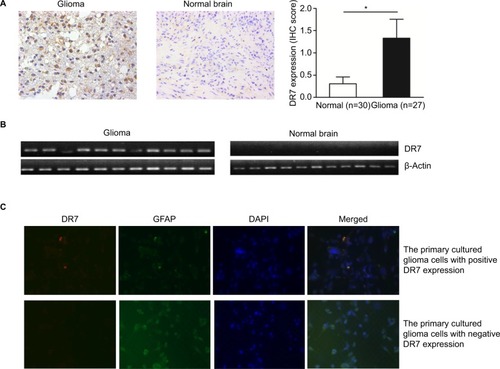
Figure 2 DR7 promotes cell proliferation and colony formation.
Notes: (A) Effect of DR7 on cell proliferation was assessed by CCK-8 assay. U87 and U251 cell proliferation was significantly inhibited after transfection with DR7. ***P<0.001. (B, C) Soft agar clones of U87, U251 cells and their counterparts treated with blank or NC were counted after 72 hours of culture. Representative images were obtained at 40× magnification. **P<0.01, *P<0.05.
Abbreviations: CCK-8, Cell Counting Kit-8; DR7, direct repeat 7.
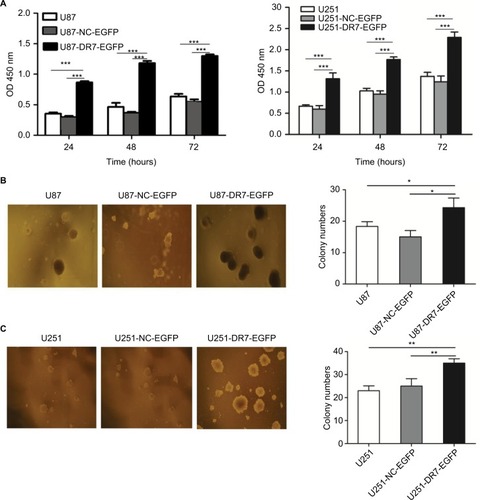
Figure 3 DR7 promotes the transition of cells from G1 to S and M phases of cell cycle.
Notes: (A, B) The cell cycle distribution of U87, U87-NC-EGFP and U87-DR7-EGFP cells was analyzed by FACS. The histogram shows the percentage of the three cells at the G0/G1, S and G2/M phases of the cell cycle. The differences in cell cycle distribution among three types of cells were analyzed. (C, D) Replication of cell cycle assays in the U251 cells demonstrated similar results. ***P<0.001, **P<0.01, *P<0.05.
Abbreviations: DR7, direct repeat 7; FACS, fluorescence-activated cell sorting.
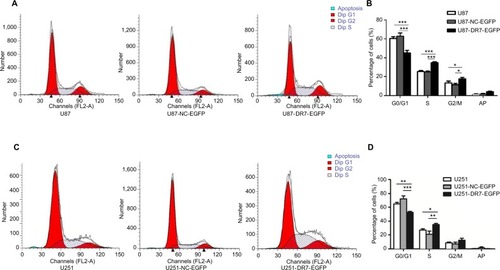
Figure 4 DR7 promotes cell migration, invasion and angiogenesis of U87.
Notes: U87 (A) and U251 (C) cells migrated into the wound area. Representative images were pictured at indicated time points. Representative images were obtained at 100× magnification. (B, D) show the respective cure rates of wound. (E, F) Transwell assays were used for testing the invasion ability of U87 and U251 cells after culturing for 48 hours. The histogram represents the mean and SD of cells traversing to reverse face of the Matrigel-coated chambers’ membrane. Representative images were obtained at 200× magnification. The effect of DR7 on angiogenesis of U87 (G) and U251 (I) cells was evaluated by CAM assays. The number of primary blood vessels converging to tumors induced by U87 (H) and U251 cells (J) was counted and compared among the three groups. ***P<0.001, **P<0.01.
Abbreviations: CAM, chorioallantoic membrane; DR7, direct repeat 7.
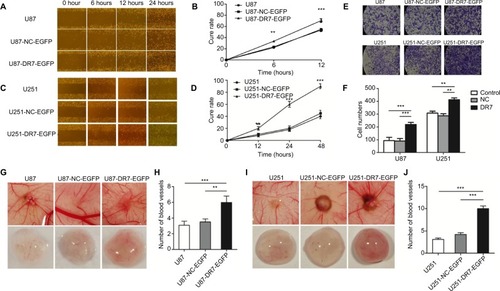
Table 1 The important DR7 target genes associated with tumor progression identified by mRNA microarray in the U87 cells
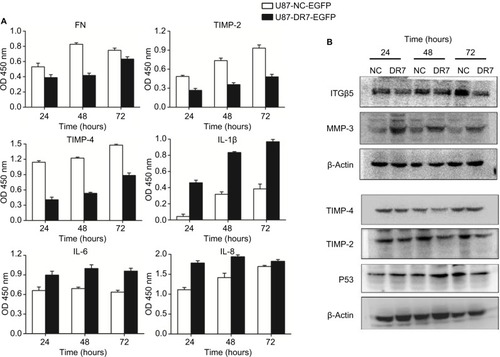
Figure 5 Validation of expression of the selected important genes associated with tumor progression.
Notes: (A) Expression of DR7 targets, FN, TIMP-2, TIMP-4, IL-1β, IL-6 and IL-8, was validated by ELISA in the crude culture medium of U87 cells. After stopping the enzymatic reaction with H2SO4, OD was measured at 450 nm. All assays were performed in triplicate. (B) Expression of DR7 targets, ITGβ5, MMP-3 and P53, was validated by Western blot in the whole cell extracts of U87 cells. Expression of TIMP-2 and TIMP-4 was once again validated using Western blot.
Abbreviation: DR7, direct repeat 7.