
Figures & data
Figure 1 Schematic illustration of the inclusion criteria for this study.
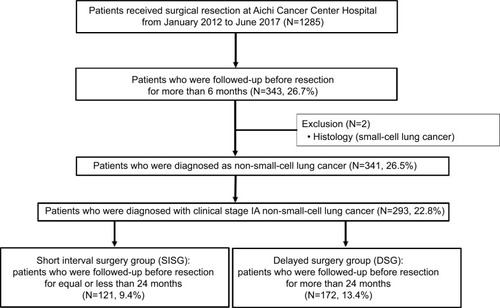
Figure 2 Histogram of enrolled patients and the therapeutic outcomes.
Notes: (A) The therapeutic prognosis corresponded to disease-free survival based on the longest intervals (>84 months [6 years]). Black bars: HR of overall survival in each pathological size with significance *P<0.05; gray bars: non-significant. (B) The time period between the first detection of suspected non-small-cell lung cancer opacities and the date of pulmonary resection. Black bars: shorter-interval surgery group (SISG) and gray bars: longer-interval surgery group (LILG).
![Figure 2 Histogram of enrolled patients and the therapeutic outcomes.Notes: (A) The therapeutic prognosis corresponded to disease-free survival based on the longest intervals (>84 months [6 years]). Black bars: HR of overall survival in each pathological size with significance *P<0.05; gray bars: non-significant. (B) The time period between the first detection of suspected non-small-cell lung cancer opacities and the date of pulmonary resection. Black bars: shorter-interval surgery group (SISG) and gray bars: longer-interval surgery group (LILG).](/cms/asset/ea3575a9-e427-4502-b4f7-346e47f24062/dcmr_a_12185992_f0002_b.jpg)
Table 1 Characteristics of patients
Figure 3 Kaplan–Meier graphs of overall survival in the study population.
Notes: (A) Disease-free survival after the first detection of potential non-small-cell lung cancer opacities in the study population. Black line, the LISG (n=172) and red line, the SISG (n=121). (B) Overall survival at the first detection. Black line, the LISG (n=172) and red line, the SISG (n=121). *P<0.05.
Abbreviations: LISG, longer-interval surgery group; SISG, shorter-interval surgical group.
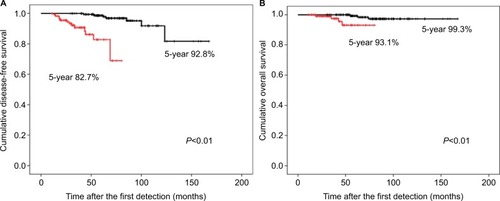
Table 2 Results of univariate and multivariate analyses for disease-free survival after the first detection of potential NSCLC opacities
Figure 4 Kaplan–Meier graphs of overall survival in the SISG.
Notes: (A) Disease-free survival after the first detection of potential NSCLC opacities in all enrolled patients. Black line: the LISG (n=172); blue line: the low-risk SISG (n=81); and red line: the high-risk SISG (n=40). (B) Overall survival at the first detection. Black line: the LISG (n=172); blue line: the low-risk SISG (n=81); and red line: the high-risk SISG (n=40). *Indicates significance (P<0.05).
Abbreviations: CT, computed tomography; LISG, longer-interval surgery group; NSCLC, non-small-cell lung cancer; SISG, shorter-interval surgical group.
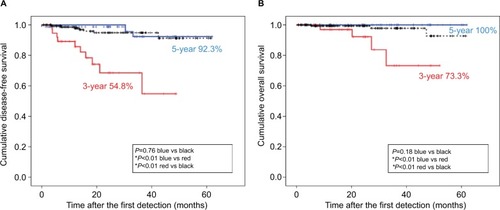
Table 3 The relationship among the mutation status and the other prognostic factors