Figures & data
Table 1 Distribution of train and test sets
Table 2 Baseline characteristics of T2DM patients with and without pancreatic cancer
Table 3 Accuracy analysis of LR and ANN models across all data set
Figure 1 The ROC curve of the LR model.
Note: The AUC across all data for the LR model is 0.727.
Abbreviations: AUC, area under the ROC curve; LR, logistic regression; ROC, receiver operating characteristic.
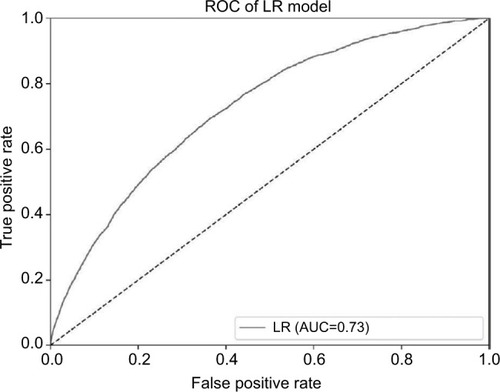
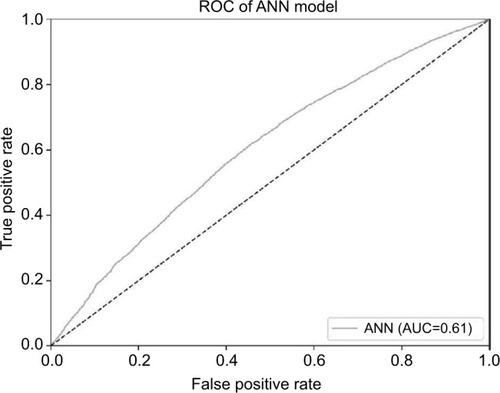
Figure 2 The ROC curve of the ANN model.
Note: The AUC curve across all data for the ANN model is 0.605.
Abbreviations: ANN, artificial neural network; AUC, area under the ROC curve; ROC, receiver operating characteristic.