Figures & data
Figure 1 miR-600 inhibits the expression of METTL3.
Notes: (A)The mRNA expression of METTL3 in A549 and H1299 cells with the transfection of METTL3-specific siRNA (the METTL3-KD group) decreasing significantly compared with that of negative siRNA (the NC group). (B) METTL3 protein level of the METTL3-KD group also decreases in comparison to the NC group in both A549 and H1299 cells. (C) The predicted binding sites of METTL3 and miR-600. (D) Luciferase reporter gene assay was performed to confirm the combination of METTL3 and miR-600. (E) The METTL3 mRNA level was detected by using qPCR. (F) The METTL3 protein level was detected by using Western blot. (G) The values of the band intensity represent the densitometry estimation of each band normalized to GAPDH. Experiments in this figure were all performed in triplicate (*P<0.05).
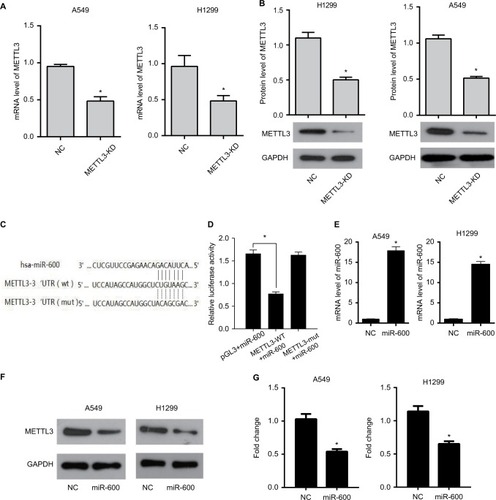
Figure 2 The m6A RNA methylation levels are reduced.
Notes: The m6A content in the total RNA of the METTL3-KD group was significantly reduced than that of the NC group in A549 (A) and H1299 (B) cells. Experiments in this figure were all performed in triplicate (*P<0.05).
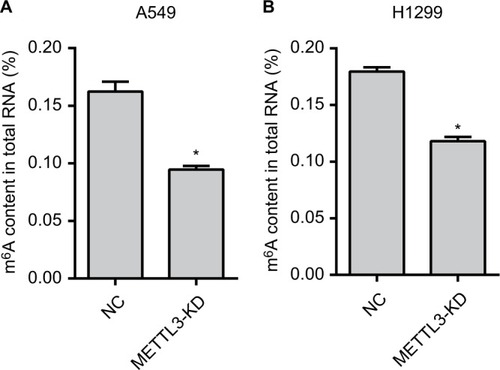
Figure 3 Knockdown of METTL3 reduces the viability of lung cancer cells.
Notes: (A) Results of qPCR showed that knocking down METTL3 did not affect miR600 expression in both A549 and H1299 cells. (B) The proliferation curves of A549 (left) and H1299 (right) cells transfected with METTL3-specific siRNA were detected by using CCK8. (C, D) Plate clonality assay. Experiments in this figure were all performed in triplicate (*P<0.05 vs NC; #P<0.05 vs METTL3-KD).
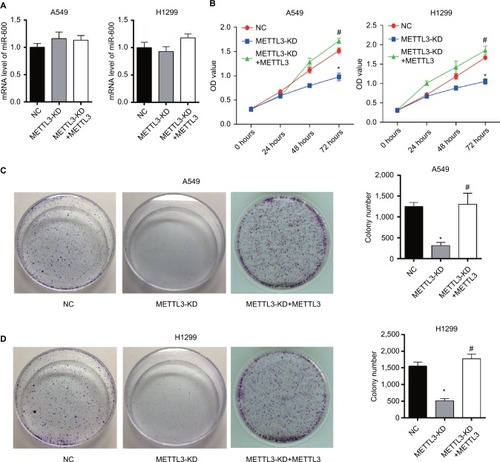
Figure 4 Transwell assay of lung cancer cells.
Notes: Knockdown of METTL3 inhibited the invasion of A549 (A) and H1299 (B) cells. Experiments in this figure were all performed in triplicate (*P<0.05).
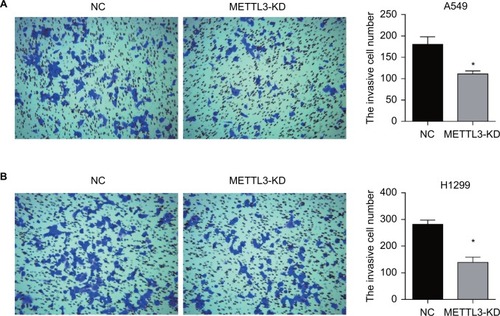
Figure 5 Knockdown of METTL3 induced apoptosis in lung cancer cells.
Notes: Knockdown of METTL3 promoted the apoptosis of A549 (A) and H1299 (B) cells. (C) Western blot was performed to analyze the expression of apoptosis-related protein, including BCL2, active caspase 3, Bax, pro- and cleaved-PARP. GAPDH served as a loading control. (D) The values of the band intensity represent the densitometry estimation of each band normalized to GAPDH (*P<0.05).
Abbreviation: PI, propidium iodide.
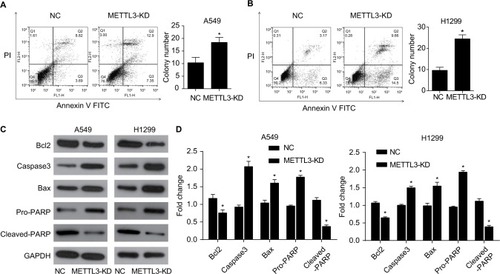
Figure 6 Knockdown of METTL3 induced apoptosis through the AKT signaling pathway.
Notes: (A) The expression of AKT pathway related proteins was analyzed by Western blot. (B) The values of the band intensity represent the densitometry estimation of each band normalized to GAPDH. Experiments in this figure were all performed in triplicate (*P<0.05).
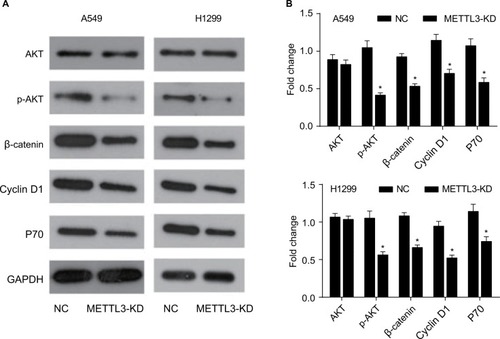
Figure 7 Knockdown of METTL3 decreased the expressions of its target genes.
Notes: (A) The expressions of EGFR, TAZ, and DNMT3A proteins were analyzed by Western blot. (B) The values of the band intensity represent the densitometry estimation of each band normalized to GAPDH. Experiments in this figure were all performed in triplicate (*P<0.05).
Abbreviation: EGFR, epidermal growth factor receptor.
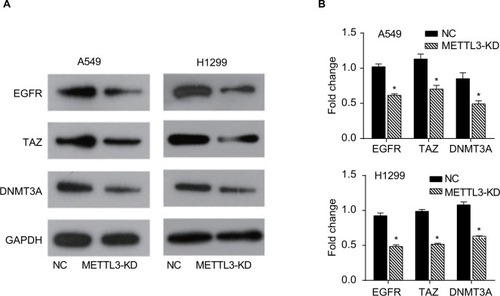
Figure 8 miR-600 reversed the positive effect of exogenous METTL3 on lung cancer cells progression.
Notes: The proliferation of A549 (A) and H1299 (B) cells was confirmed by CCK8 assay. (C–F) Transwell assay was performed to confirm the cell invasion in METTL3 and METTL3+ miR-600 cells. Experiments in this figure were all performed in triplicate (*P<0.05 vs NC cells; #P<0.05 vs METTL3 overexpression cells).
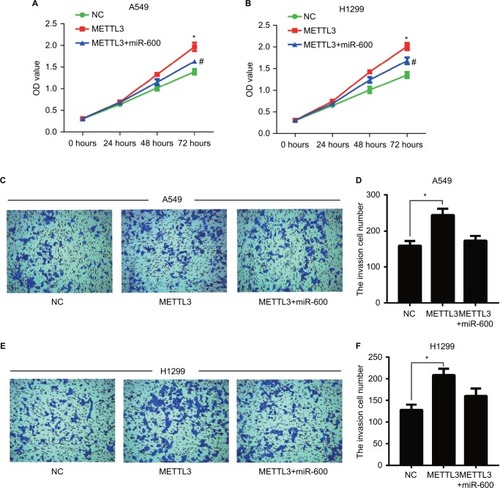
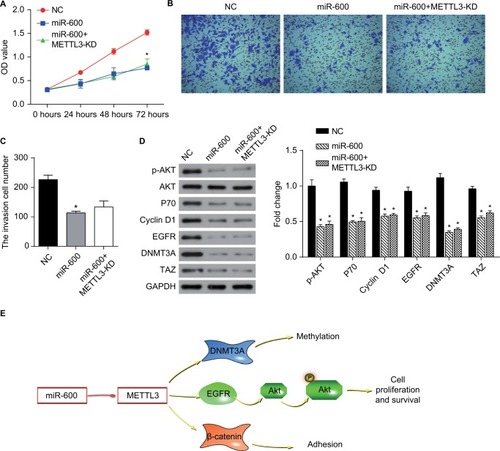
Figure 9 miR-600 suppressed cell growth by the inhibition of METTL3 expression in human lung cancer.
Notes: (A) The proliferation of A549 cells was confirmed by CCK8 assay. (B, C) Transwell assay was performed to confirm the cell invasion in miR-600 and miR-600+METTL3-KD cells. (D) The expression levels of proteins were analyzed by Western blot. The values of the band intensity represent the densitometry estimation of each band normalized to GAPDH. Experiments in this figure were all performed in triplicate (*P<0.05). (E) A model depicting the mechanism of miR-600 suppressed cell growth by the inhibition of METTL3 expression in human lung cancer.
Abbreviation: EGFR, epidermal growth factor receptor.