
Figures & data
Figure 1 Flowchart of bioinformatics analysis.
Abbreviations: DEGs, differentially expressed genes; GEO, Gene Expression Omnibus; KEGG, Kyoto Encyclopedia of Genes and Genomes; PPI, protein–protein interaction; TCGA, The Cancer Genome Atlas project.

Figure 2 Identification of DEGs in HCC-mRNA expression profiling datasets.
Notes: (A) Volcano plot of DEGs in datasets GSE57957, GSE64041, and GSE76427. (B) Cluster analysis of DEGs in these three GEO datasets.
Abbreviations: DEGs, differentially expressed genes; FC, fold change; GEO, Gene Expression Omnibus; HCC, Hepatocellular carcinoma.
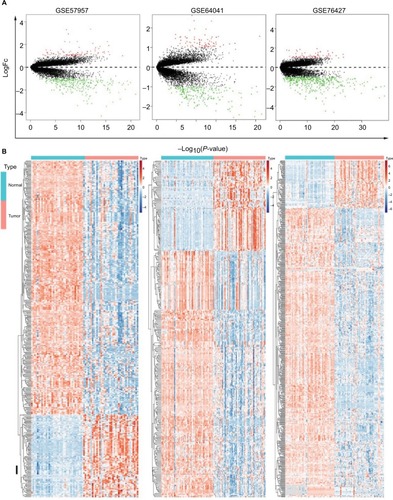
Figure 3 Gene oncology and KEGG pathway enrichment analysis of intersection mRNAs.
Notes: (A) Venn diagram analysis of DEGs in comparison groups (a) upregulated DEGs and (b) downregulated DEGs. (B) Gene oncology analysis of downregulated intersection DEGs. (C) KEGG pathway enrichment analysis of upregulated and downregulated intersection DEGs.
Abbreviations: DEGs, differentially expressed genes; KEGG, Kyoto Encyclopedia of Genes and Genomes.
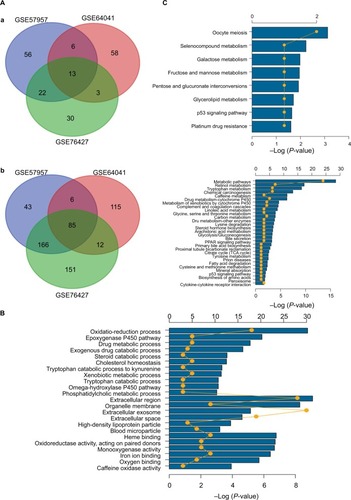
Figure 4 PPI network of DEGs. Red means upregulated genes and green indicates downregulated genes.
Abbreviations: DEGs, differentially expressed genes; PPI, protein–protein interaction.
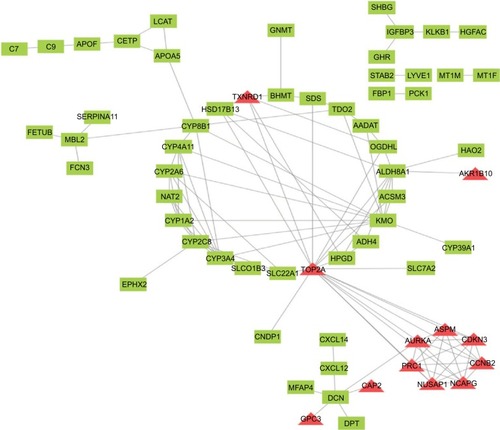
Table 1 Univariate Cox regression analysis: P<0.05
Table 2 Coefficients of the four-gene signature for the risk score
Figure 5 Four-gene signature prognostic risk scoring model analysis of HCC patients’ prognosis in TCGA dataset.
Notes: (A) Distribution of patients’ survival status and four prognostic DEGs’ expression heat map in low-risk and high-risk groups. (B) Kaplan–Meier survival curves for low-risk and high-risk groups.
Abbreviations: DEGs, differentially expressed genes; HCC, hepatocellular carcinoma; TCGA, The Cancer Genome Atlas project.
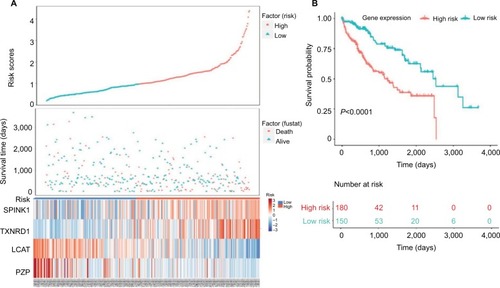
Figure 6 Validation of four-gene signature prognostic risk scoring model of HCC patients in GSE14520 dataset.
Notes: (A) Distribution of patients’ survival status and four prognostic DEG expression heat map in low-risk and high-risk groups. (B) Kaplan–Meier survival curves for low-risk and high-risk groups.
Abbreviations: DEGs, differentially expressed genes; HCC, hepatocellular carcinoma.
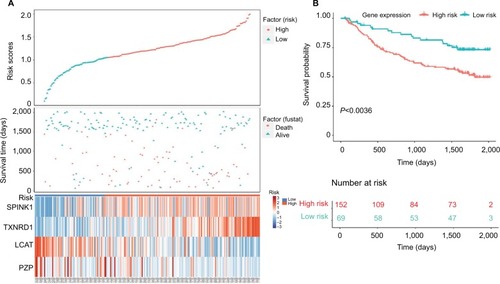
Figure 7 The expression of SPINK1, TXNRD1, LCAT, and PZP in gene and protein levels.
Notes: (A) Relative mRNA levels of SPINK1, TXNRD1, LCAT, and PZP expression in TCGA, GSE14520 dataset, and human liver tumor tissues and adjacent normal tissues in patients (n=50). (B) Immunohistochemistry staining of HCC specimens with antibodies specific for SPINK1, TXNRD1, LCAT, or PZP. Original magnification, ×200. (C) Kaplan–Meier analysis of overall survival was stratified by expression levels of SPINK1, TXNRD1, LCAT, and PZP protein expression. **P<0.01, ***P<0.001, ****P<0.0001.
Abbreviations: GEO, Gene Expression Omnibus; HCC, hepatocellular carcinoma; TCGA, The Cancer Genome Atlas project.
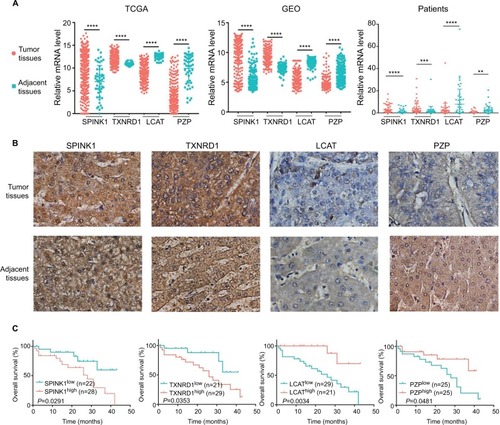
Figure 8 Correlation analysis between the expression of SPINK1, TXNRD1, LCAT, and PZP and their methylation.
Notes: (A) The correlation analysis between SPINK1 and methylation. (B) The correlation analysis between TXNRD1 and methylation. (C) The correlation analysis between LCAT and methylation. (D) The correlation analysis between PZP and methylation.
Abbreviations: Cor, correlation; TCGA, The Cancer Genome Atlas project.
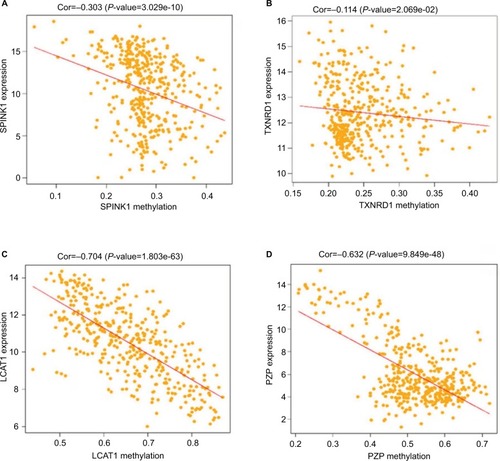
Figure S1 Gene ontology enrichment terms for DEGs.
Abbreviations: DEGs, differentially expressed genes; FC, fold change; GO, gene ontology.
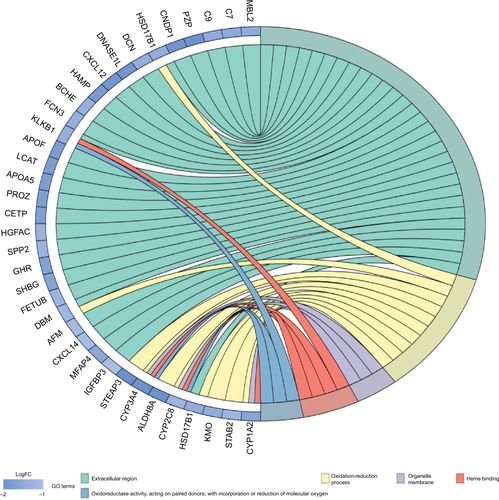
Figure S2 KEGG network analysis.
Abbreviation: KEGG, Kyoto Encyclopedia of Genes and Genomes.
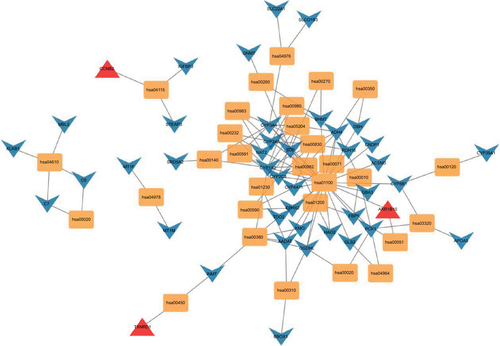
Figure S3 Detailed methylation information of (A) SPINK1, (B) TXNRD1, (C) LCAT, and (D) PZP.
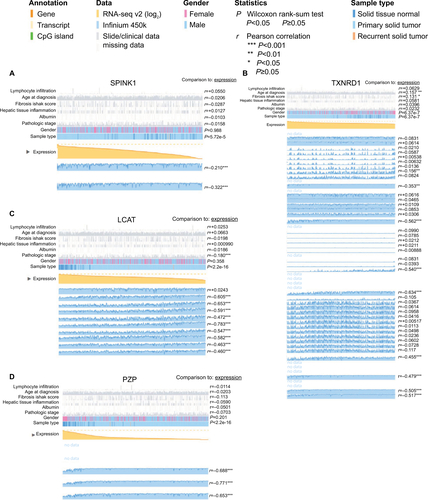
Table S1 The sequence of PCR primers