Figures & data
Figure 1 p53 expression pattern was associated with tumor budding status in T1 CRC patients.
Note: (Top) Tumor with many buds at the invasive front (A) positively expressed of p53 (B). (Bottom) Tumors with negative budding status at the invasive front (C) barely expressed p53 (D).
Abbreviation: CRC, colorectal carcinoma.
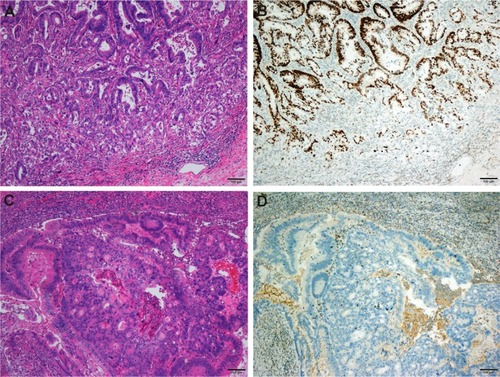
Table 1 Relationship between histopathological factors and LNM in submucosal invasive colorectal carcinoma
Table 2 Univariate and multivariate risk analysis of lymph node metastasis in submucosal invasive colorectal carcinoma
Figure 2 ROC curves of the three adverse factors.
Note: The combination of these three factors provided the highest AUC value (AUC: 0.76), indicating optimal predictive ability of LNM status.
Abbreviations: AUC, area under the curve; LNM, lymph node metastasis; ROC, receiver operator characteristic.
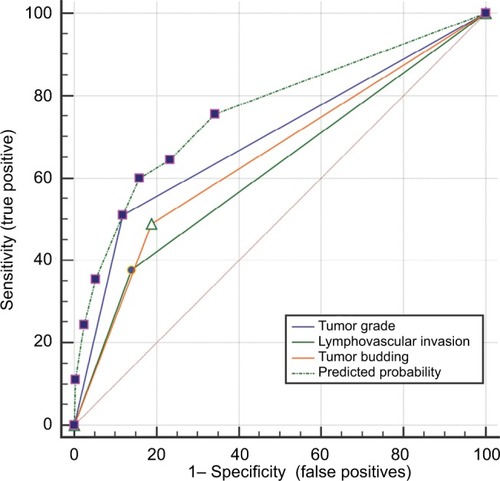
Table 3 Correlation between MMR and p53 expression and clinicopathological features in submucosal invasive colorectal carcinoma
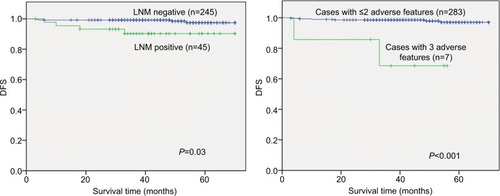
Figure 3 Kaplan–Meier DFS curve of T1 CRC patients with different lymph node statuses (A) (negative, n=245 vs positive, n=45) or numbers of adverse features (B). Cases with ≤2 adverse features (n=283 vs cases with 3 adverse features, n=7).
Abbreviations: CRC, colorectal carcinoma; DFS, disease-free survival.