Figures & data
Figure 1 The results of hierarchical clustering analysis for DEGs between GC tissues and noncancerous tissues.
Notes: (A) GSE49051. (B) GSE79973. (C) GSE54129. (D) Venn diagram analyzing the intersection of the three data sets.
Abbreviations: DEGs, differentially expressed genes; GC, gastric cancer.
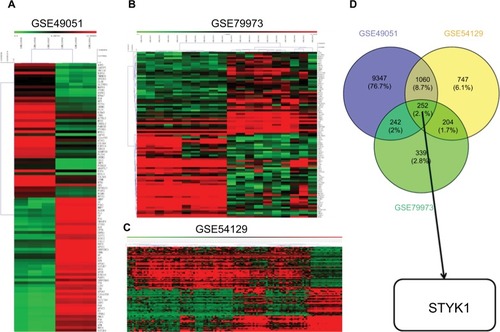
Figure 2 STYK1 expression is increased in various cancers other than GC.
Note: The HR of STYK1 expression in gallbladder carcinoma, lung cancer, colorectal cancer, nasopharyngeal carcinoma, pancreatic cancer, and hepatocellular carcinoma pooled by meta-analysis is shown.
Abbreviation: GC, gastric cancer.
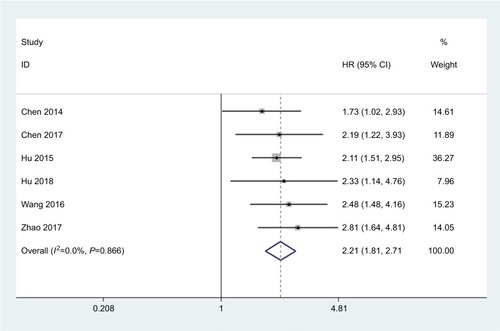
Figure 3 Analysis of STYK1 mRNA expression in GC tissues and normal tissues based on public databases.
Notes: (A) Cho gastric statistics, (B) Cui gastric statistics, (C) D’Errico gastric statistics, (D) Wang gastric statistics. All data are from Oncomine. (E) STYK1 expression analysis based on TCGA database. *P<0.05; **P<0.01.
Abbreviations: GC, gastric cancer; TCGA, The Cancer Genome Atlas.
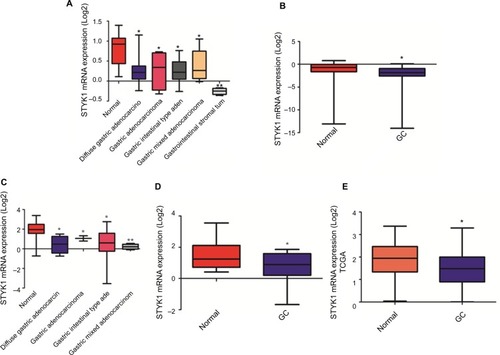
Figure 4 STYK1 protein expression in primary GC tissues and GC cell lines.
Notes: (A) Representative immunohistochemical staining of STYK1 in GC tissues (0 points) and adjacent normal tissues (9 points). Scale bar: 100 μm, magnification for left panel ×40; right panel ×100. (B) Western blot of STYK1 protein expression in four GC cell lines and one normal GES-1.
Abbreviations: GC, gastric cancer; GES-1, gastric mucosal epithelial cell line.
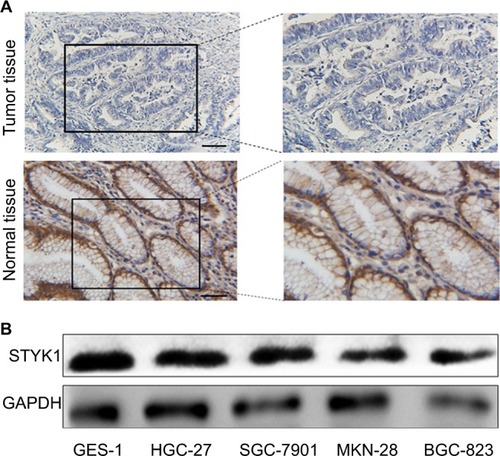
Table 1 The correlation of STYK1 expression with the clinical features of GC
Table 2 Univariate and multivariate analyses of prognostic factors for OS in GC
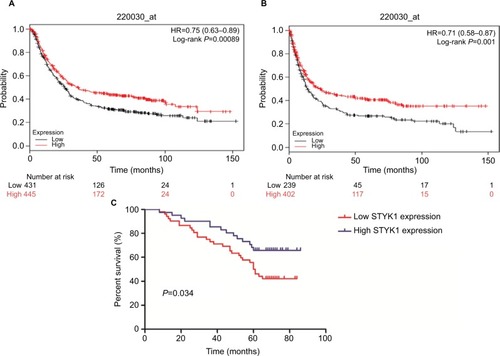
Figure 5 Prognostic significance of STYK1 protein expression in patients with GC.
Notes: Kaplan–Meier plotter analysis of the effect of STYK1 mRNA expression levels on the OS (A) and PFS (B) in patients with GC. (C) Kaplan–Meier analysis of the correlation between STYK1 expression and survival in 93 patients with GC.
Abbreviations: GC, gastric cancer; PFS, progression-free survival.