
Figures & data
Figure 1 Histogram and box plots illustrating the frequency distribution of XPC and ABCG2 polymorphisms and stratified clinicopathological characteristics.
Notes: Pie chart (A) and histogram chart (B) illustrating the frequency distribution of XPC rs2607775 and ABCG2 rs2231142 and rs2622621 genotypes classified by lymph node metastasis status (node negative, node positive) and ABCG2 rs2231142 genotypes classified by first-degree family history of cancer (no and yes).
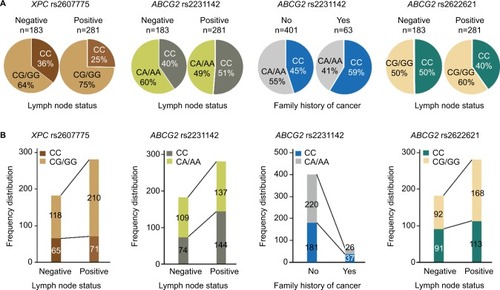
Table 1 Multivariate Cox hazard regression analysis of SNPs of DNA repair genes and ABCG2 gene in association with DFS and OS in CRC patients treated with oxaliplatin-based chemotherapy (n=580)
Table 2 Stratification analysis of SNPs of XPA and ABCG2 in association with DFS and OS in CRC patients treated with oxaliplatin-based chemotherapy (n=580)
Figure 2 Kaplan–Meier survival curves estimate the correlation of DFS and OS in advanced CRC patients with oxaliplatin-based chemotherapy and XPA gene and ABCG2 gene.
Notes: (A) Kaplan–Meier cum hazard survival curves illuminating the correlation between the XPA rs10817938 and ABCG2 rs2231142 and rs2622621 polymorphisms and DFS in advanced CRC patients treated with oxaliplatin-based chemotherapy (log-rank test: P=0.055, 0.001, and 0.008, respectively). (B) Kaplan–Meier cum hazard survival curves illuminating the correlation between the XPA rs10817938 and ABCG2 rs2231142 and rs2622621 polymorphisms and OS in advanced CRC patients treated with oxaliplatin-based chemotherapy (log-rank test: P=0.008, <0.0001, and 0.022, respectively).
Abbreviations: CRC, colorectal cancer; DFS, disease-free survival; OS, overall survival; MST, median survival time.
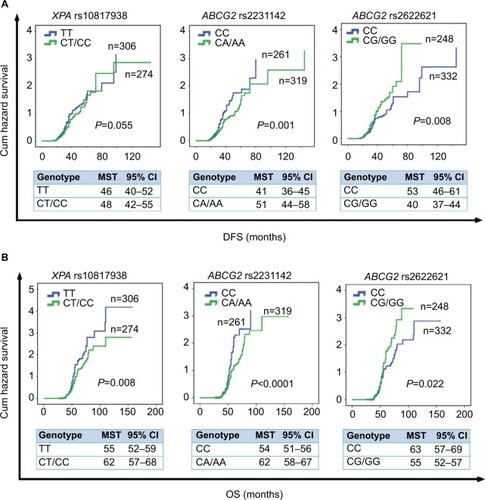
Figure 3 Stratification analyze the relationship between the XPA and ABCG2 polymorphisms and OS in advanced CRC patients using Kaplan–Meier analysis.
Notes: Stratification analysis illustrating XPA rs10817938 CT/CC and ABCG2 rs2231142 CA/AA and rs2622621 CC genotypes had prolonged OS time in CRC patients with tumor differentiation grade 3 (P=0.007, <0.0001, and 0.029, respectively) (A), clinical stage IV (P=0.004, <0.0001, and 0.024, respectively) (B), and lymph node-positive status (P=0.002, 0.001, and 0.037, respectively) (C).
Abbreviations: CRC, colorectal cancer; OS, overall survival.
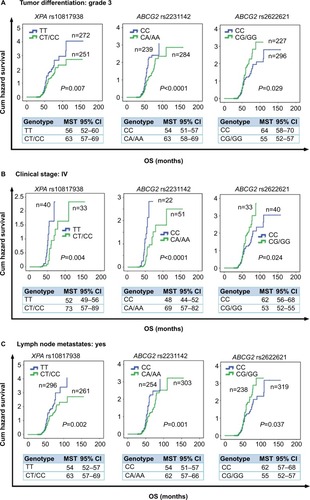
Figure 4 Stratification analyze the relationship between the XPA and ABCG2 polymorphisms and DFS in advanced CRC patients using Kaplan–Meier analysis.
Notes: Stratification analysis using Kaplan–Meier method illustrating the correlation between XPA rs10817938 CT/CC and ABCG2 rs2231142 CA/AA and rs2622621 CC genotypes and DFS time in CRC patients with tumor differentiation grade 3 (P=0.056, 0.0001, and 0.007, respectively) (A), clinical stage IV (P=0.044, <0.0001, and 0.009, respectively) (B), and lymph node-positive status (P=0.025, 0.002, and 0.018, respectively) (C).
Abbreviations: CRC, colorectal cancer; DFS, disease-free survival; MST, median survival time.
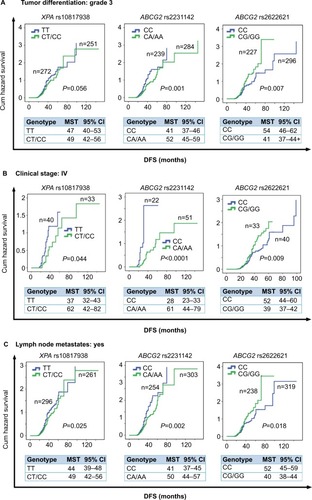
Table 3 MDR analysis for the prediction of prognosis with and without six candidate SNPs’ genotypes