
Figures & data
Table 1 Clinicopathological characteristics of ESCC patients according to PD-L1 and PD-L2 expressions
Table 2 Clinicopathological characteristics of ESCC patients according to the numbers of PD-1+, CD8+, and TIGIT+ TILs
Figure 1 Expression patterns of PD-L1, PD-L2, CD8, PD-1, and TIGIT in ESCC samples.
Notes: (A and B) Representative immunohistochemical images of PD-L1 and PD-L2 expressions, which were scored from 0 to 3+. Cases displaying scores of 0 or 1+ were considered negative for PD-L1 and PD-L2 expressions, whereas those displaying scores of 2+ or 3+ were considered positive (original magnification, 200×). (C–E) Representative immunohistochemical images from cases with low vs high numbers of CD8+, PD-1+, and TIGIT+ TILs (original magnification, 200×).
Abbreviations: ESCC, esophageal squamous cell carcinoma; TILs, tumor-infiltrating lymphocytes.
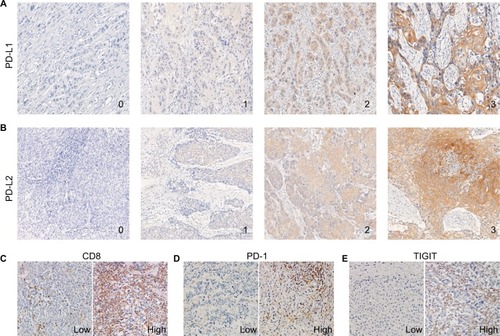
Figure 2 The correlation between the densities of PD-1+, CD8+, and TIGIT+ cells and association with PD-L1 and PD-L2 expression status in ESCC samples.
Notes: (A) The number of PD-1+ TILs was significantly positively correlated with the number of CD8+ TILs and TIGIT+ TILs per unit area (mm2). (B) Comparing the number of CD8+, PD-1+, and TIGIT+ TILs according to the PD-L1 and PD-L2 expression status in ESCC patients. The number of CD8+ TILs was much higher in ESCC cases displaying PD-L1 expression compared with those lacking PD-L1 expression (P=0.0157). However, the number of PD-1+ TILs and TIGIT+ TILs did not differ according to the PD-L1 expression status. The number of CD8+ TILs, PD-1+ TILs, and TIGIT+ TILs did not differ according to the PD-L2 expression status.
Abbreviations: ESCC, esophageal squamous cell carcinoma; TILs, tumor-infiltrating lymphocytes.
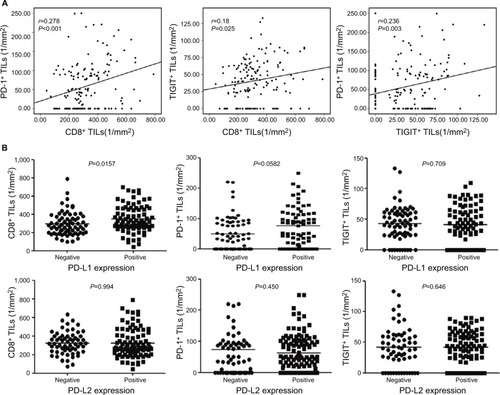
Figure 3 Kaplan–Meier analyses of OS of 154 ESCC patients according to CD8, PD-1, TIGIT, PD-L1, and PD-L2 expressions alone or combined.
Notes: (A and B) Patients with a high number of PD-1+ or TIGIT+ TILs tended to exhibit a shorter OS (P=0.044 and 0.045). (C and D) Patients with a positive expression of PD-L1 or PD-L2 tended to exhibit a shorter OS (P=0.005 and 0.002). (E) Comparing the OS between CD8+/PD-1+ (yellow line), CD8+/TIGIT+ (green line), CD8+/PD-1+/TIGIT+ (purple line), CD8- (blue line) TILs, and CD8+ TILs (red line) in ESCC. (F) Comparing the OS between PD-1+/TIGIT− (green line), PD-1−/TIGIT+ (purple line), PD-1+/TIGIT+ (blue line), and PD-1−/TIGIT− (red line) TILs in ESCC. (G) Comparing the OS between tumor with PD-L1-positive/PD-L2-negative (green line), PD-L1-negative/PD-L2-positive (purple line), PD-L1-positive/PD-L2-positive (blue line) expressions and those with PD-L1-negative/PD-L2-negative (red line) expression in ESCC. (H) Comparing the OS between patients with PD-1+/TIGIT+ TILs and PD-L1 and/or PD-L2-positive tumor cells (blue line) and patients with PD-1−/TIGIT− TILs and PD-L1 and PD-L2-negative tumor cells (red line) in ESCC. Comparing the OS between patients with PD-1+/TIGIT− (purple line), PD-1−/TIGIT+ (yellow line), and PD-1−/TIGIT− (red line) TILs in PD-L1- and PD-L2-negative tumor cells of ESCC. Comparing the OS between patients with PD-1+/TIGIT− (gray line), PD-1−/TIGIT+ (green line), and PD-1+/TIGIT+ (blue line) TILs in PD-L1- and/or PD-L2-positive tumor cells of ESCC.
Abbreviations: ESCC, esophageal squamous cell carcinoma; OS, overall survival; TILs, tumor-infiltrating lymphocytes.
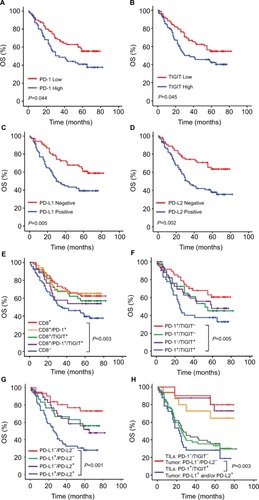
Table 3 Univariate and multivariate analyses of overall survival in ESCC
Table S1 Clinicopathological features of the 154 esophageal cancer patients (at the time of initial diagnosis)