Figures & data
Table 1 Correlation of miR-299-5p expression with clinicopathologic characteristics in PTC
Figure 1 miR-299-5 p was downregulated and associated with gender and ETE in PTC tissues.
Notes: (A) The relative expression levels of miR-299-5p in 109 PTC tissues and paired adjacent normal thyroid tissues. (B) The relative expression levels of miR-299-5p in 74 female and 35 male PTC tissues. (C) The relative expression levels of miR-299-5p in 31 ETE and 78 non-ETE PTC tissues. (D) The relative expression levels of miR-299-5p in PTC cell lines (BCPAP) and normal human thyroid follicular epithelial cell line (Nthy-ori 3-1). All experiments were determined by qRT-PCR. The Mann–Whitney U test was used to analyze the differences between the two groups; data are presented as the median (IQR). *P<0.05; **P<0.01.
Abbreviations: ETE, extrathyroidal extension; PTC, papillary thyroid cancer; qRT-PCR, quantitative real-time reverse transcription PCR.
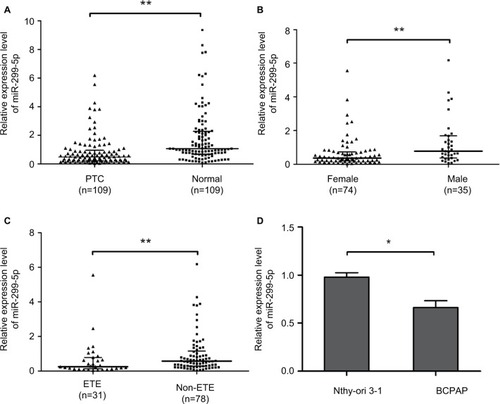
Figure 2 miR-299-5p inhibited the migration and invasion of PTC cells.
Notes: (A) A wound healing assay was applied to analyze the migration capacity of PTC cells after transfection with miR-299-5p mimic or NC. (B) Transwell assays were used to evaluate the invasion capacity in PTC cells after transfection with miR-299-5p mimic or NC. For the migration and transwell assays, cells in five random fields were counted under a microscope at 100× magnification. Data are presented as the mean±SD. **P<0.01 vs NC.
Abbreviations: NC, negative control; PTC, papillary thyroid cancer.
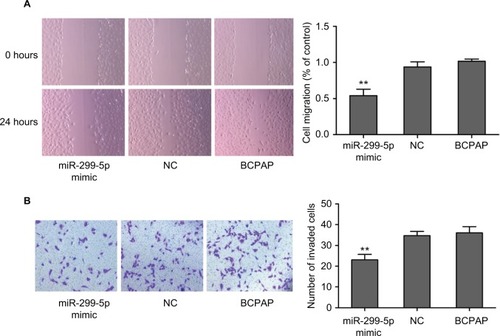
Figure 3 ERα was a direct target of miR-299-5p.
Notes: (A) Relative mRNA expression level of ESR1 was detected by qRT-PCR, and protein expression level of ERα was detected using Western blotting in PTC cells transfected with miR-299-5p mimic or NC. Data are presented as the mean±SD, analyzed using independent samples t-test. *P<0.05 vs NC. (B) The predicted miR-299-5p binding sites in ESR-1-3′-UTR-Wt and the designed mutant sequence (ESR-1-3′-UTR-Mt) are indicated, and a luciferase reporter assay was conducted. Data are presented as the mean±SD. *P<0.05 vs ESR-1-3-3′-UTR-Wt+NC. ESR-1-3′-UTR-Wt, 3′-UTR region of ESR1
Abbreviations: ERα, estrogen receptor α; NC, negative control; qRT-PCR, quantitative real-time reverse transcription PCR.
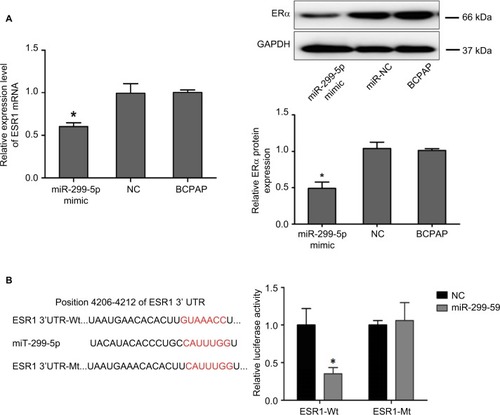
Figure 4 ERα was overexpressed and associated with migration and invasion in PTC.
Notes: (A) The relative mRNA expression level of ESR1 in 109 PTC tissues and paired adjacent normal thyroid tissues was determined using qRT-PCR. (B) The relative mRNA expression level of ESR1 in 74 female and 35 male PTC tissues was determined using qRT-PCR. (C) The relative mRNA expression level of ESR1 in 31 ETE and 78 non-ETE PTC tissues was determined using qRT-PCR. (D) The protein expression level of ERα was detected using IHC in PTC tissues and adjacent normal thyroid tissues. (E) The protein expression of ERα was detected using Western blotting in PTC tissues and adjacent normal thyroid tissues. (F) Transwell assays were used to evaluate the invasion capacity after upregulating and downregulating ERα levels in PTC cells. Data are presented as the mean±SD. *P<0.05, **P<0.01 vs NC. #P<0.05 vs NC.
Abbreviations: ERα, estrogen receptor α; ETE, extrathyroidal extension; IHC, immunohistochemistry; NC, negative control; PTC, papillary thyroid cancer; qRT-PCR, quantitative real-time reverse transcription PCR.
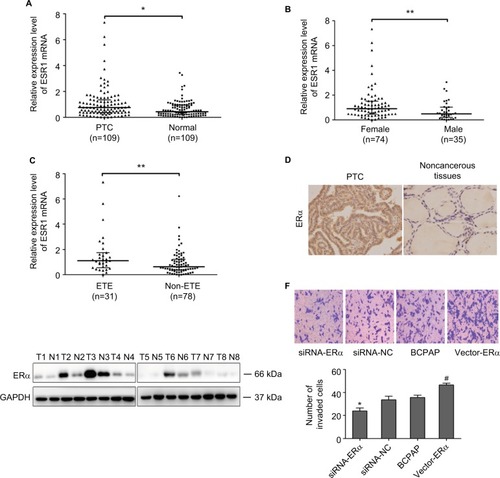
Figure 5 Overexpression of ERα could partly impair miR-299-5p induced inhibition of malignant and invasion behavior in PTC cells.
Notes: (A) Relative mRNA expression level of ESR1 was detected using qRT-PCR, and the protein expression level of ERα was detected using Western blotting in PTC cells transfected with miR-299-5p mimic, miR-299-5p+ERα, or NC. (B) A wound healing assay was applied to analyze the migration capacity in PTC cells after transfection with miR-299-5p mimic, miR-299-5p+ERα, or NC. (C) Transwell assays were used to evaluate the invasion in PTC cells after transfection with miR-299-5p mimic, miR-299-5p+ERα, or NC. Data are presented as the mean±SD. *P<0.05 vs NC, #P<0.05 vs miR-299-5p+ERα.
Abbreviations: ERα, estrogen receptor α; NC, negative control; PTC, papillary thyroid cancer; qRT-PCR, quantitative real-time reverse transcription PCR.
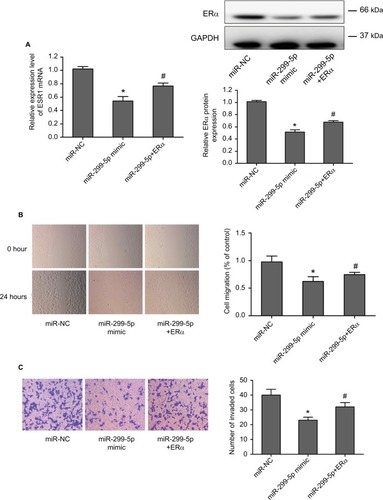
Figure 6 miR-299-5p regulates migration and invasion through ERα/Gli1 complex.
Notes: (A) The protein expression level of Gli1 was detected using IHC in PTC tissues and adjacent normal thyroid tissues. (B) The protein expression level of Gli1 was detected using Western blotting in PTC tissues and adjacent normal thyroid tissues. (C) The invasion capacity after upregulating and downregulating Gli1 in PTC cells were evaluated using Transwell assays. (D) The protein expression level of Gli1 was detected using Western blotting in PTC cells transfected with miR-299-5p mimic, miR-299-5p+ERα, or NC. Data are presented as the mean±SD. *P<0.05 vs NC, #P<0.05 vs miR-299-5p+ERα. (E) BCPAP cell lysates were coimmunoprecipitated with ERα antibody and followed by Western blotting assay with anti-Gli1 antibodies. (F) Schematic of the proposed mechanism of miR-299-5p in PTC. In ERα-positive cell lines, miR-299-5p may inhibit the migration and invasion of PTC cells by targeting ERα to affect the expression of Gli1.
Abbreviations: ERα, estrogen receptor α; Gli1, GLI family zinc finger 1; IHC, immunohistochemistry; NC, negative control; PTC, papillary thyroid cancer.
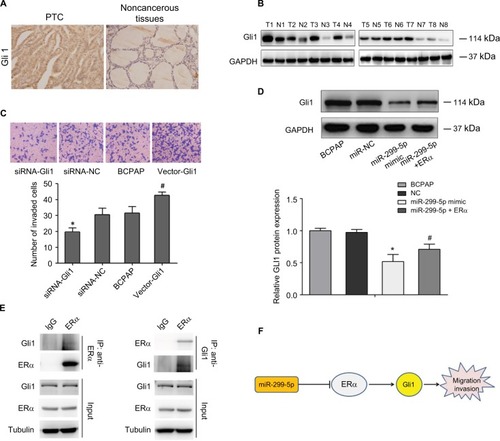
Figure S1 miR-299-5p expression between male (n=35) and female (n=35) patients.
Note: **P<0.01.
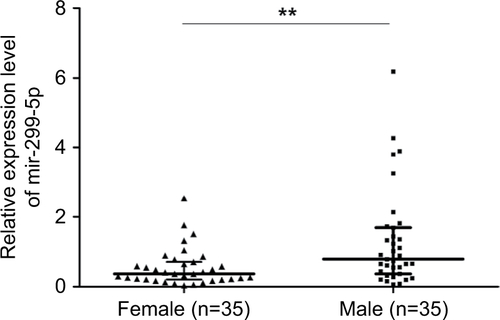
Figure S2 miR-299-5p expression in male and female patients in different age subgroups.
Notes: (A) miR-299-5p expression between reproductive age (≤45 years) and advanced reproductive age (>45 years) subgroups in male patients. (B) miR-299-5p expression between reproductive age (≤45 years) and advanced reproductive age (>45 years) subgroups in female patients. **P<0.01.
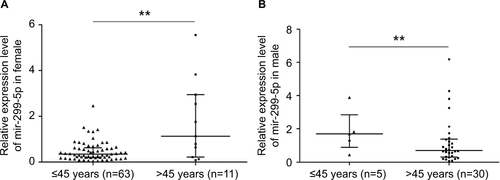
Figure S3 miR-299-5p expression in ETE vs non-ETE patients in gender-specific and age-specific manners.
Notes: (A) miR-299-5p expression between ETE and non-ETE subgroups in female patients. (B) miR-299-5p expression between ETE and non-ETE subgroups in male patients. (C) miR-299-5p expression between ETE and non-ETE subgroups in reproductive age (≤45 years) patients. (D) miR-299-5p expression between ETE and non-ETE subgroups in advanced reproductive age (>45 years) patients. *P<0.05 and **P<0.01.
Abbreviation: ETE, extrathyroidal extension.
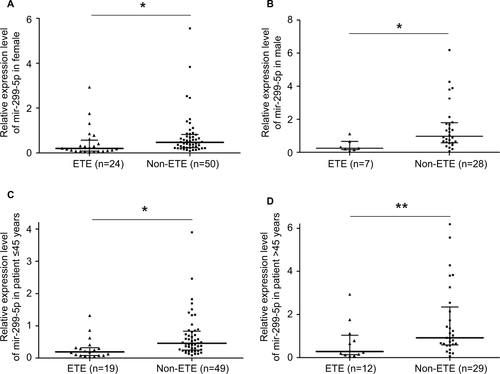
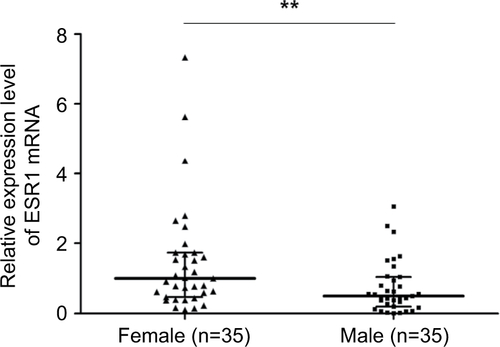
Figure S4 ESR1 expression between male (n=35) and female (n=35) patients.
Note: **P<0.01.