
Figures & data
Table 1 Primers for qRT-PCR
Figure 1 NLRP6 is downregulated in gastric cancer tissues.
Notes: (A) NLRP6 expression was significantly decreased in gastric cancer tissues compared with that in normal gastric tissues based on the data from the TCGA data set (P<0.01). (B) Survival analysis of 254 patients from the GSE 66229 data set. The survival time in patients with higher NLRP6 expression patients was significantly longer than that in patients with lower NLRP6 expression. (C) qRT-PCR analysis of NLRP6 expression in 45 pairs of gastric cancer and its corresponding normal tissues (P<0.0001). (D) Western blot analysis of NLRP6 protein expression in 16 pairs of gastric cancer (T1–T16) and its corresponding normal tissues (N1–N16). (E) NLRP6 protein expression was assessed by IHC staining in gastric cancer tissues. Scale bar: 200 µm. (F) Survival analysis of 120 patients with gastric cancer.
Abbreviations: TCGA, The Cancer Genome Atlas; qRT, quantitative reverse transcription; IHC, immunohistochemistry.
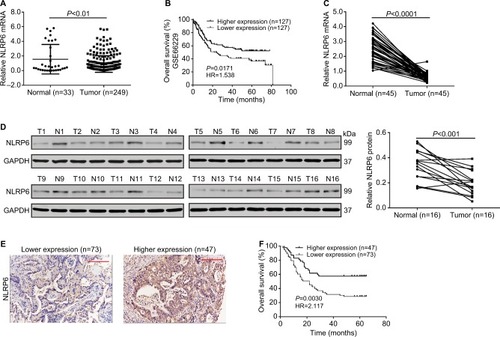
Table 2 Correlation of NLRP6 expression with patients’ features in gastric cancer
Figure 2 NLRP6 inhibits cell proliferation of gastric cancer cells.
Notes: (A) Overexpression of NLRP6 in BGC-823 and HGC-27 cells was confirmed by Western blot. Blots are representative of three separate experiments. (B) Cell proliferation was detected at 0, 24, 48, and 72 hours in BGC-823 and HGC-27 stable cells by CCK-8 assay (n=3). (C) Annexin V/PI assay showed that NLRP6 overexpression increased cell early and late apoptosis rates (n=3). (D) NLRP6 inhibits gastric cancer cell proliferation in vivo. BGC-823 cells stably expressed NLRP6 or control vector were subcutaneously inoculated into nude mice (six per group). Tumor volume was measured for 27 days. NLRP6-overexpressed BGC-823 cells grew much slower in nude mice than the control cells (left panels). At 27 days, mice were sacrificed and the tumors were isolated. IHC staining of Ki-67 and TUNEL assay were performed on the xenograft tumors (n=3, right panels). WT, wild-type cells; vector, cells stably expressed control vector; NLR6, cells stably expressed NLRP6. **P<0.01 and ***P<0.001.
Abbreviations: CCK-8, Cell Counting Kit-8; PI, propidium iodide; IHC, immunohistochemistry; FITC, fluorescein isothiocyanate.
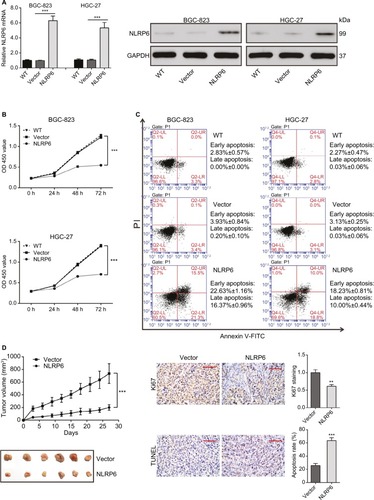
Figure 3 NLRP6 overexpression inhibits the migration and invasion of gastric cancer cells.
Notes: Transwell assays were performed to evaluate cell migration (A) and invasive abilities (B) (n=3). For invasion, the upper chamber was precoated with Matrigel. WT, wild-type cells; vector, cells stably expressed control vector; NLR6, cells stably expressed NLRP6. ***P<0.001.
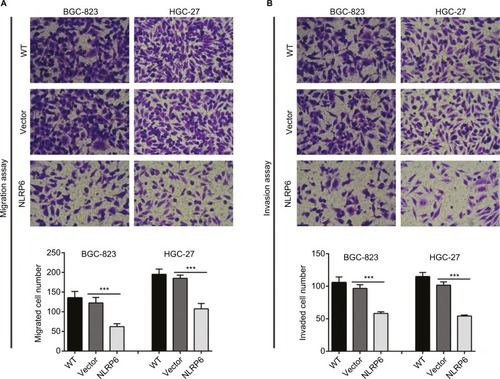
Figure 4 Effects of NLRP6 on STAT3 signaling.
Notes: (A) Immunoblot of phosphorylated STAT3, STAT3, Bcl-2, and MMP-2. Blots are representative of three separate experiments. (B) mRNA levels of Bcl-2 and MMP-2 were assessed by qRT-PCR. (C) BGC-823 and HGC-27 cells were transfected with a Bcl-2 or an MMP-2 luciferase reporter plasmid. The cells were then cultured for 48 hours before determination of normalized luciferase activity. WT, wild-type cells; vector, cells stably expressed control vector; NLR6, cells stably expressed NLRP6. ***P<0.001.
Abbreviation: qRT, quantitative reverse transcription.
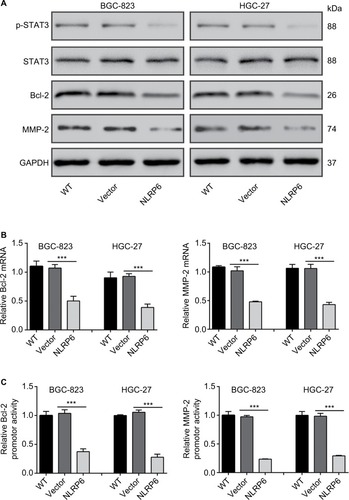
Figure 5 Effect of H. pylori on NLRP6 expression.
Notes: (A and B) BGC-823 and HGC-27 cells were infected with H. pylori at an MOI of 0, 25, or 100 for 24 hours. The protein (A) and mRNA (B) levels of NLRP6 were detected. (C) The potential binding sites in the promoter of the NLRP6 genes for FOXO3 were shown based on the online program ALGGEN – PROMO. (D) The levels of p-AKT, AKT, p-FOXO3, and FOXO3 in gastric cancer cells with H. pylori infection were determined by Western blot. (E–G) BGC-823 and HGC-27 cells were transfected with siFOXO3 and siNC for 48 hours. Western blot (E), real-time PCR (F), and luciferase reporter assays (H) were performed. (H–J) Gastric cancer cells were treated with 20 µM of LY294002 of DMSO followed by infection with H. pylori (MOI of 100) for 24 hours. Western blot (H), real-time PCR (I), and luciferase reporter assays (J) were performed. *P<0.05, **P<0.01, and ***P<0.001.
Abbreviations: H. pylori, Helicobacter pylori; TSS, transcription start site; siFOXO3, FOXO3 siRNA; siNC, negative control siRNA; DMSO, dimethyl sulfoxide; MOI, multiplicity of infection; LY, LY294002.
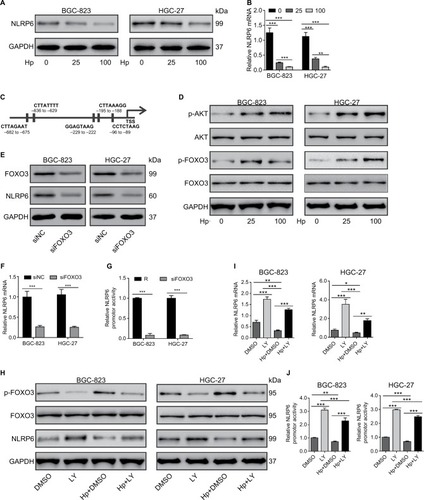
Figure S1 NLRP6-associated pathways in gastric cancer.
Notes: GSEA was performed on TCGA data set by using GSEA version 2.0 from the Broad Institute at MIT as previously described.Citation1 Gene set permutations were performed 1,000 times, and the pathway set list was sorted by the NES. GSEA was performed using TCGA data set. The cell apoptosis (A) and metastasis (B) pathways were strongly associated with NLRP6 lower expression.
Abbreviations: GSEA, gene set enrichment analysis; TCGA, The Cancer Genome Atlas; NES, normalized enrichment score; ES, enrichment score.
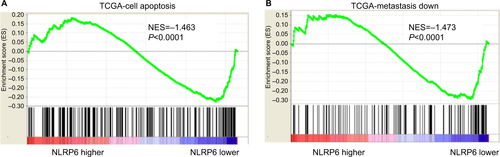
Figure S2 NLRP6 protein expression and mRNA expression in seven gastric cancer cell lines were determined by qRT-PCR (A) and Western blot (B) analysis, respectively.
Abbreviation: qRT, quantitative reverse transcription.
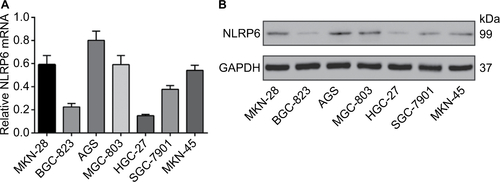
Figure S3 NLRP6 knockdown in AGS cells promoted cell proliferation, migration, and invasion but inhibited cell apoptosis. (A) qRT-PCR (upper panel) and Western blot (lower panel) analysis of knockdown efficiency in AGS cells. (B) CCK-8 assay showed that NLRP6 knockdown promoted cell proliferation. (C) Annexin V/PI assay showed that NLRP6 knockdown decreased cell early and late apoptosis. (D) Transwell assays showed that NLRP6 knockdown enhanced migration and invasive capacity. WT, wild-type cells. **P<0.01 and ***P<0.001.
Abbreviations: qRT, quantitative reverse transcription; CCK-8, Cell Counting Kit-8; PI, propidium iodide; siNC, negative control siRNA.
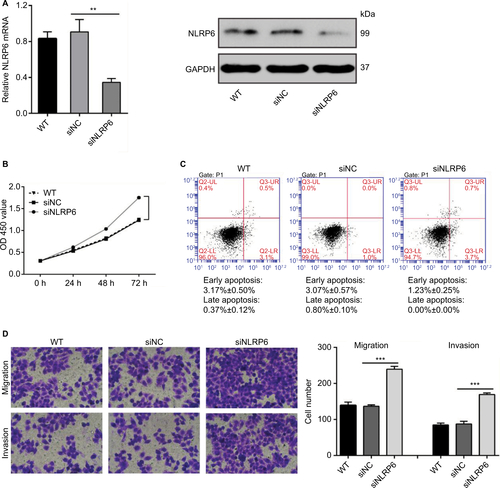
Figure S4 Effects of NLRP6 knockdown on STAT3 phosphorylation.
Notes: Blots are representative of three separate experiments. WT, wild-type cells; siNC, negative control siRNA.

Table S1 Univariate Cox regression of prognostic parameters for survival in patients with gastric cancer
Table S2 Multivariate Cox regression of prognostic parameters for survival in patients with gastric cancer