Figures & data
Figure 1 (A) Study of enriched GO terminology and KEGG pathways for DCTN genes assessed by DAVID; (B) DCTN gene interaction networks among selected genes generated by GeneMANIA; (C) STRING physical and functional connections of DCTN genes.
Abbreviations: DAVID, Database for Explaining, Visualization, and Integrated Discovery; DCTN, dynactin; ER, endoplasmic reticulum; GeneMANIA, Gene Multiple Association Network Integration Algorithm; GO, gene ontology; KEGG, Kyoto Encyclopedia of Genes and Genomes; MHC, major histocompatibility complex; STRING, Search Tool for the Retrieval of Interacting Genes/Proteins.
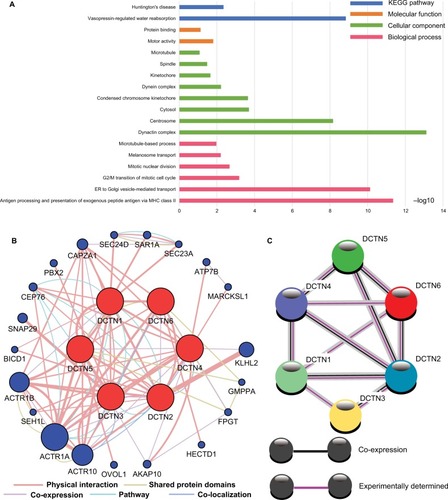
Figure 2 (A) Pearson’s correlation coefficients for DCTN gene expression levels, *P<0.001; (B) scatterplots for DCTN gene family expression levels in TCGA.
Abbreviations: DCTN, dynactin; TCGA, The Cancer Genome Atlas.
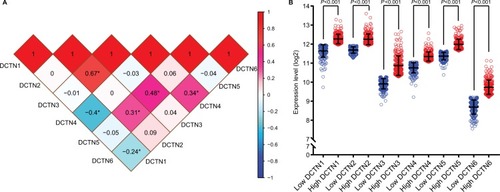
Figure 3 MERAV boxplots of expression of DCTN family in normal tissues and tumor-bearing tissues.
Note: Boxplots are shown for the expression levels of (A) DCTN1; (B) DCTN2; (C) DCTN3; (D) DCTN4; (E) DCTN5; and (F) DCTN6.
Abbreviations: DCTN, dynactin; MERAV, Metabolic gEne RApid Visualizer.
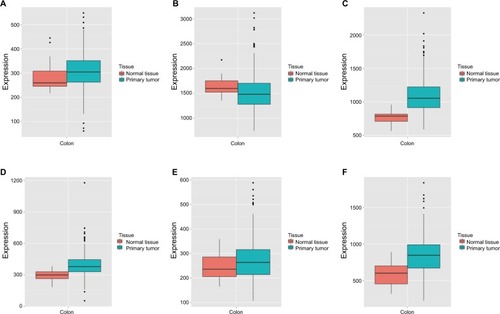
Figure 4 ROCs of six DCTN genes, showing differences between COAD tissue and adjacent normal colon tissue.
Note: ROCs of six prognostic differentially expressed miRNAs: (A) DCTN1; (B) DCTN2; (C) DCTN3; (D) DCTN4; (E) DCTN5; and (F) DCTN6.
Abbreviations: COAD, colon adenocarcinoma; DCTN, dynactin; ROC, receiver operating characteristics.
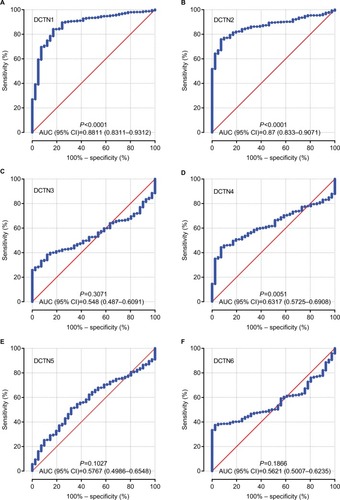
Table 1 Demographic and clinical data for 438 COAD patients
Table 2 Prognostic survival analysis according to high or low expression of DCTN family genes
Figure 5 Prognostic graphs of DCTN expression for overall survival.
Note: Kaplan–Meier survival curves for complete COAD patients according to expression of (A) DCTN1; (B) DCTN2; (C) DCTN3; (D) DCTN4; (E) DCTN5; and (F) DCTN6 (n=438).
Abbreviations: COAD, colon adenocarcinoma; DCTN, dynactin.

Figure 6 Nomogram for the relations hip between medical data and risk score.
Abbreviation: DCTN, dynactin.
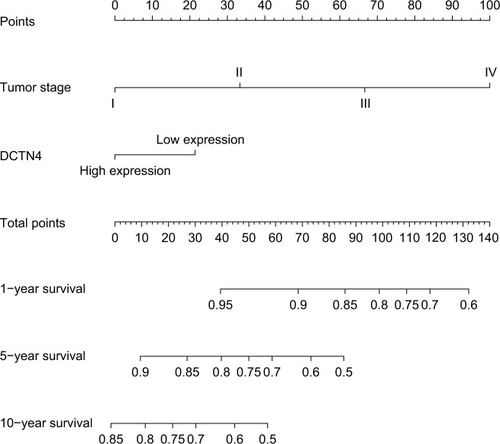
Figure 7 GSEA outcomes achieved for KEGG pathway analysis for higher and lower levels of expression of DCTN4, using gene set c2.
Note: (A) Metastasis; (B) cancer relapse tumor sample; (C) colon cancer recurrence; (D) metastasis; (E) EIF pathway; (F) metastasis; (G) inhibited invasion; (H) oncogenesis; (I) cell cycle S.
Abbreviations: DCTN, dynactin; EIF, eukaryotic initiation factor; ES, enrichment score; FDR, false discovery rate; GSEA, Gene Set Enrichment Analysis; KEGG, Kyoto Encyclopedia of Genes and Genomes; NES, normalized enrichment score; NOM, nominal.
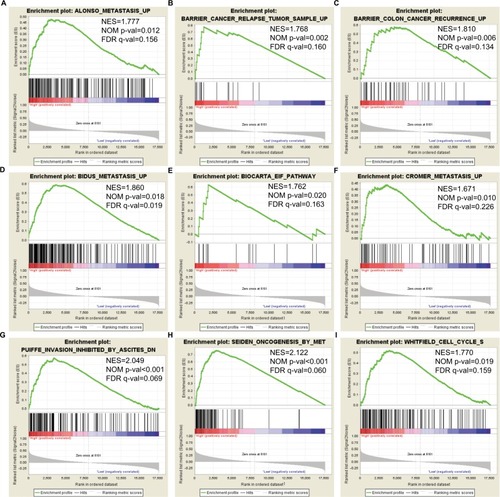
Figure 8 Pearson’s correlations among DCTN4 and possible associated COAD gene cohort of TCGA.
Note: An absolute value of the correlation coefficient >0.4 was considered to be highly correlated.
Abbreviations: COAD, colon adenocarcinoma; DCTN, dynactin; TCGA, The Cancer Genome Atlas.
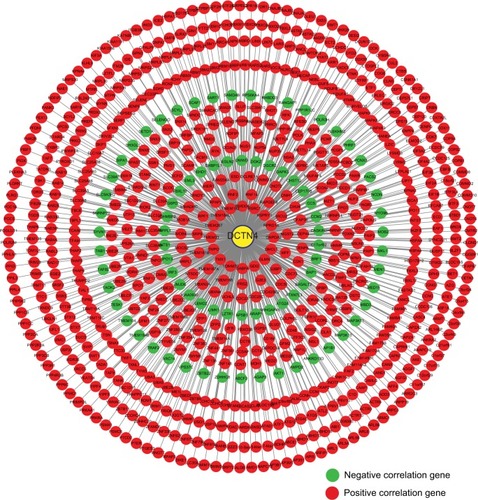
Figure 9 Analysis of GO terms that are enriched and KEGG pathways for DCTN4 and the linked COAD gene cohort of TCGA obtained using DAVID.
Notes: Outcomes of GO analysis of functional enrichment: (A) BP outcomes; (B) CC outcomes; (C) MF outcomes; (D) KEGG outcomes. *P<0.001.
Abbreviations: BP, biological process; CC, cellular component; CDK, cyclin-dependent kinase; COAD, colon adenocarcinoma; DAVID, Database for Annotation, Visualization, and Integrated Discovery; DCTN, dynactin; GO, gene ontology; KEGG, Kyoto Encyclopedia of Genes and Genomes; MAPK, mitogen-activated protein kinase; MF, molecular functionality; NAFLD, nonalcoholic fatty liver disease; NF, nuclear factor; RIG-I-like receptor, retinoic acid-inducible gene-I-like receptor; TCGA, The Cancer Genome Atlas.
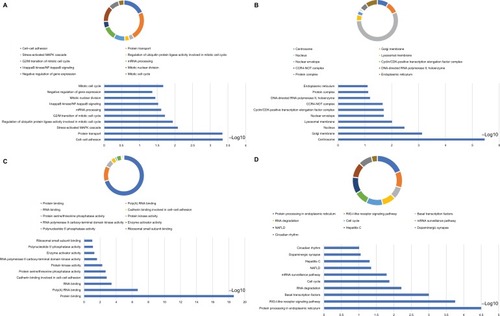
Figure 10 GO analysis of functional enrichment by BiNGO for all the correlated genes.
Note: (A) BP outcomes; (B) CC outcomes; and (C) MF outcomes of GO analysis of functional enrichment by BiNGO.
Abbreviations: BiNGO, Biological Networks Gene Ontology; BP, biological process; CC, cellular component; DCTN, dynactin; ER, endoplasmic reticulum; GO, gene ontology; MF, molecular function; MLL, myeloid/lymphoid leukemia; SRP, signal recognition particle; TFIIH, transcription factor II H.
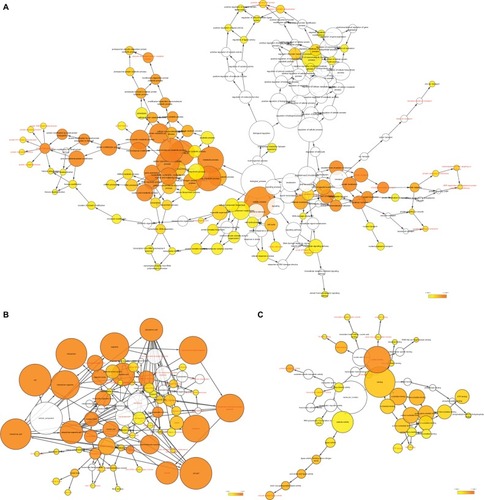
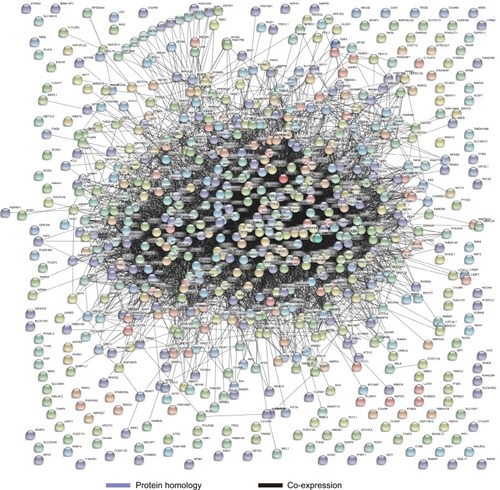
Figure 11 Gene contact networks between DCTN4 and potential-linked COAD gene cohort of TCGA generated by GeneMANIA.
Abbreviations: COAD, colon adenocarcinoma; DCTN, dynactin; GeneMANIA, Gene Multiple Connection Network Integration Algorithm; TCGA, The Cancer Genome Atlas.
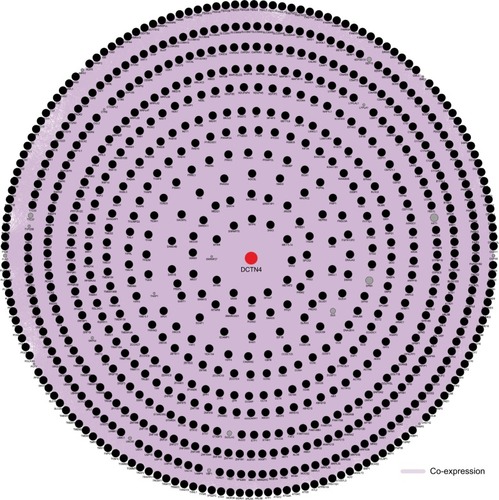
Figure 12 STRING connections with functional and physical DCTN4 and correlated genes.
Abbreviations: DCTN, dynactin; STRING, The Search Tool for the Retrieval of Interacting Genes/Proteins.