Figures & data
Table 1 Correlation between miR-491-5 p expression and different clinical characteristics
Figure 1 miIR-491-5p was downregulated in CRC tissues and cell lines.
Notes: (A) miIR-491-5p expression in CRC tissues and their matched ANTs from 80 OS patients. (B) miIR-491-5p expression in five CRC cell lines (HCT116, HCT8, HT29, SW480 and SW620) and FHC. (C) Survival analysis indicated that the CRC patients with low miIR-491-5p levels had shorter OS time when compared to those with high miIR-491-5p levels in this study. Data are shown as mean ± SD. ***P<0.001.
Abbreviations: ANTs, adjacent normal tissues; CRC, colorectal cancer; OS, overall survival.
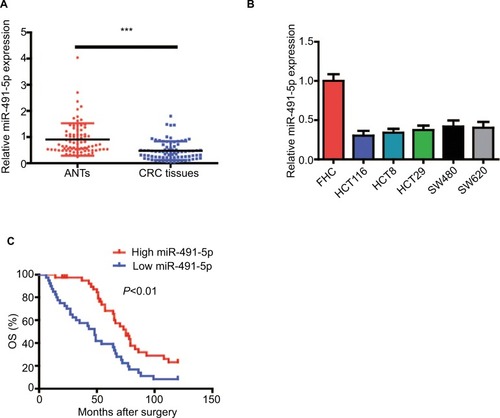
Table 2 Univariate and multivariate analyses for OS in patients with CRC
Figure 2 miIR-491-5p inhibited CRC cell proliferation in vitro.
Notes: (A) qRT-PCR analysis of miIR-491-5p expression in HCT116 and HCT8 cells after transfection of miIR-491-5p agomir/antagomir or their negative control (agomiR-NC and antagomiR-NC). (B) Cell proliferation was determined in HCT116 and HCT8 cells after transfection with miIR-491-5p agomir/antagomir or agomiR-NC/antagomiR-NC using CCK-8 assay. (C) Colony formation assay was performed to detect the ability of proliferation in HCT116 and HCT8 after transfection with miIR-491-5p agomir/antagomir or agomiR-NC/antagomiR-NC. Data are shown as mean ± SD. *P<0.05, ***P<0.001.
Abbreviations: CCK-8, cell counting kit-8; CRC, colorectal cancer; NC, negative control; OS, overall survival; qRT-PCR, quantitative real-time PCR.
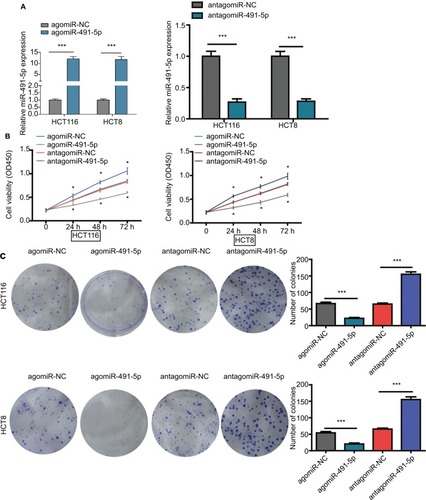
Figure 3 miIR-491-5p suppressed OS cell growth in vivo.
Notes: (A) Representative images of tumors from implanted mice. (B) Quantitative analysis of xenografted tumor volume. Data are shown as mean ± SD. ***P<0.001.
Abbreviation: OS, overall survival.
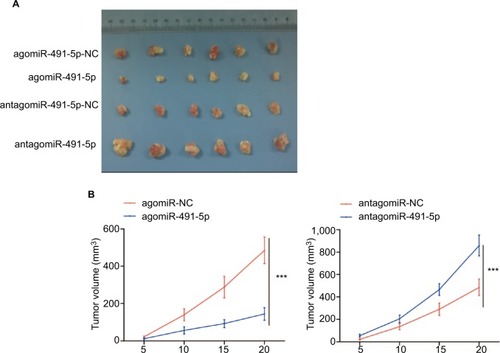
Figure 4 IGF2 is a direct target gene of miIR-491-5p.
Notes: (A) The luciferase activity was measured after cotransfecting with WT/Mut IGF2 3′-UTR plasmid and agomiIR-491-5p/agomiR-NC in 293 T cells. qRT-PCR (B) and Western blot (C) analyses were performed to detect the expression of IGF2 in HCT116 and HCT8 after transfection with agomiIR-491-5p and antagomiIR-491-5p or agomiR-NC and antagomiR-NC. Data are shown as mean ± SD of three independent experiments. *P<0.05, **P<0.01, and ***P<0.001.
Abbreviations: Mut, mutant; NC, negative control; qRT-PCR, quantitative real-time PCR; WT, wild type.
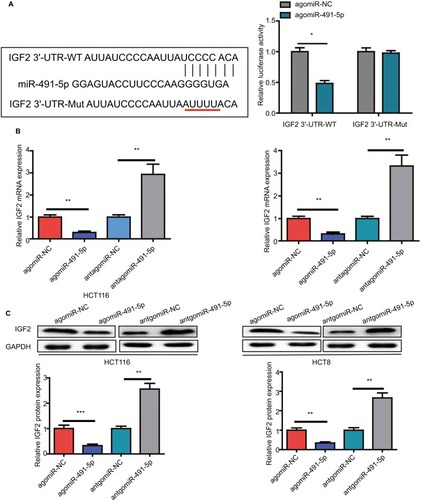
Figure 5 Overexpression of IGF2 reverses the effects induced by miIR-491-5p overexpression in HCT116 and HCT8 cells.
Notes: (A) IGF2 protein expression was detected in HCT116 and HCT8 cells cotransfected with agomiIR-491-5p and IGF2 expression plasmid or blank vector (vector). (B and C) Cell proliferation was determined in HCT116 and HCT8 cells cotransfected with agomiIR-491-5p and IGF2 expression plasmid or blank vector (vector). Data are shown as mean ± SD of three independent experiments. *P<0.05, **P<0.01, and ***P<0.001.
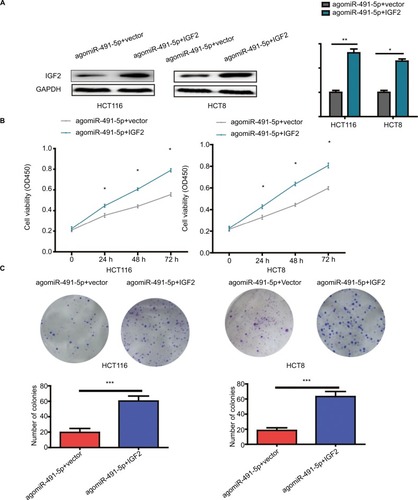
Figure 6 The relationship between miIR-491-5p and IGF2 in CRC tissues.
Notes: (A) Representative IHC staining (×200) for IGF2 from CRC tissues and matched ANTs. (B) IHC scores of IGF2 in low miIR-491-5p CRC tissues were markedly higher than those in high miIR-491-5p CRC tissues. (C) The correlation between the levels of miIR-491-5p expression and IHC scores of IGF2 in CRC tissues. (D) qRT-PCR was employed to measure the expression of IGF2 mRNA in 80 CRC specimens and corresponding ANTs. (E) The correlation analysis was performed between IGF2 mRNA and miIR-491-5p expression levels. Data are shown as mean ± SD.***P<0.001.
Abbreviations: ANTs, adjacent normal tissues; CRC, colorectal cancer; IHC, immunohistochemical; NC, negative control; qRT-PCR, quantitative real-time PCR.
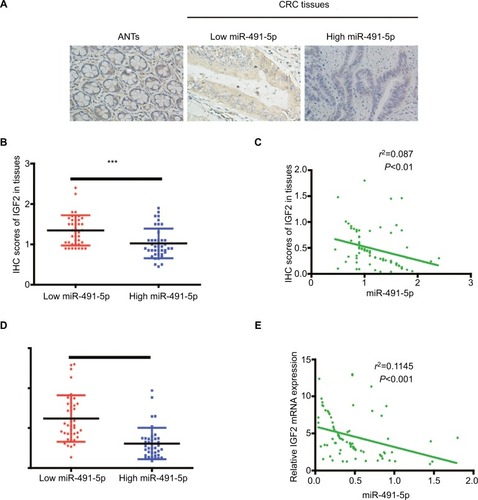
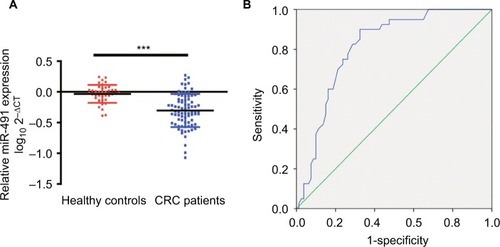
Figure 7 Plasma levels of miIR-491-5p were downregulated in CRC patients.
Notes: (A) The relative levels of miIR-491-5p in patients with CRC and healthy controls. The data are shown as log10 and normalized to cel-miR-39. (B) ROC curves for 491-5 p in 80 CRC patients and 40 healthy controls. Data are shown as mean ± SD. ***P<0.001.
Abbreviations: CRC, colorectal cancer; ROC, receiver operating characteristic.