Figures & data
Table 1 Added samples of glucose detection
Table 2 Added samples of lactic acid detection
Table 3 sgRNA sequences of GLUT-1 and HIF-1α
Figure 1 sgRNAs design of HIF-1α and GLUT-1 genomic region.
Notes: (A) GLUT-1 sgRNAs were designed to specially identify exon 3 of the GLUT-1 genomic region. Yellow: exon 3; green: sgRNA-L; blue: sgRNA-R. (B) HIF-1α sgRNAs were designed to specially identify exon 2 of the HIF-1α genomic region. Yellow: exon 2; green: sgRNA-L; blue: sgRNA-R.
Abbreviations: GLUT, glucose transporter; HIF-1α, hypoxia-inducible factor-1α; sgRNAs, small-guide RNAs.
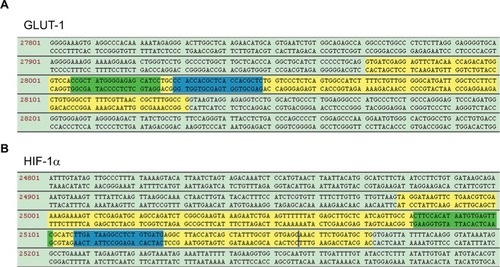
Table 4 Primers of Glut-1 and HIF-1α
Figure 2 Mutation sequence of GLUT-1 in positive cells.
Notes: (A) Schematic diagram of the GLUT-1 sgRNAs generated via the CRISPR/Cas9 system. (B) TA clone sequence of the PCR amplification products from the GLUT-1 genomic region.
Abbreviations: GLUT, glucose transporter; sgRNAs, small-guide RNAs.
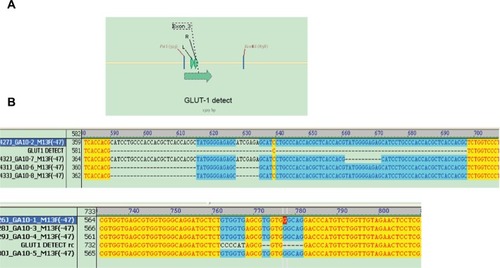
Figure 3 Mutation sequence of HIF-1α in positive cells.
Notes: (A) Schematic diagram of the HIF-1α sgRNAs generated via the CRISPR/Cas9 system. (B) TA clone sequence of the PCR amplification products from the HIF-1α genomic region.
Abbreviations: HIF-1α, hypoxia-inducible factor-1α; sgRNAs, small-guide RNAs.
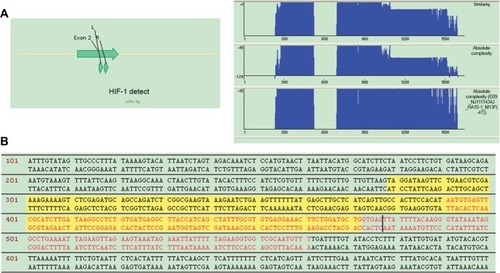
Figure 4 Measurement of HIF-1α and GLUT-1 expression in positive cells by immunoblotting.
Notes: (A) The results of Western blot. (B) There was a significantly decreased HIF-1α and GLUT-1 protein after HIF-1α and GLUT-1 double gene knockout compared with before HIF-1α and GLUT-1 double gene knockout (P<0.001, respectively). HEp-2-WT: control cells. β-Actin served as the internal control. **P<0.001.
Abbreviations: GLUT, glucose transporter; HIF-1α, hypoxia-inducible factor-1α.
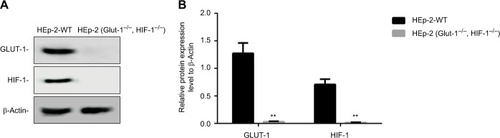
Figure 5 Effects of HIF-1α and GLUT-1 double gene knockout on proliferation of HEp-2 cells detected by CCK-8.
Note: *P<0.05, **P<0.01.
Abbreviations: CCK-8, cell counting kit-8; GLUT, glucose transporter; HIF-1α, hypoxia-inducible factor-1α.
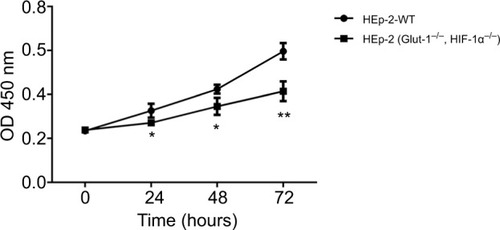
Figure 6 Effects of HIF-1α and GLUT-1 double gene knockout on the migration or invasive capacity of HEp-2 cells assessed by Transwell assays.
Notes: (A) The migration capacities of cells were significantly lower after HIF-1α and GLUT-1 double gene knockout compared with before HIF-1α and GLUT-1 double gene knockout. (B) The invasive capacities of cells were significantly lower after HIF-1α and GLUT-1 double gene knockout compared with before HIF-1α and GLUT-1 double gene knockout.
Abbreviations: GLUT, glucose transporter; HIF-1α, hypoxia-inducible factor-1α.
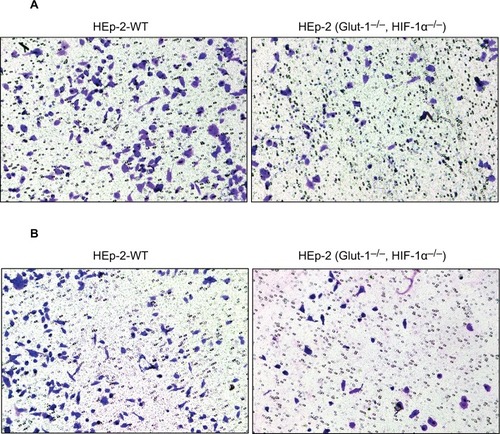
Figure 7 Effects of HIF-1α and GLUT-1 double gene knockout on glucose uptake and lactic acid generation of HEp-2 cells.
Notes: There was a significantly reduced glucose uptake (A) and lactic acid generation (B) after HIF-1α and GLUT-1 double gene knockout compared with before HIF-1α and GLUT-1 double gene knockout (P=0.005 and P=0.012, respectively). **P<0.01.
Abbreviations: GLUT, glucose transporter; HIF-1α, hypoxia-inducible factor-1α.
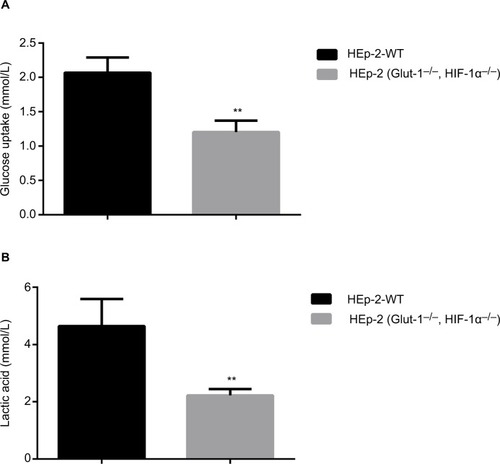
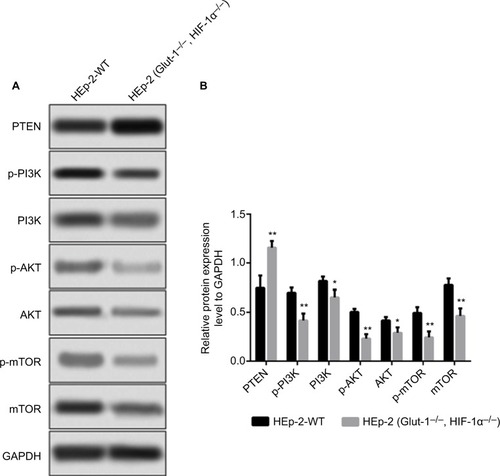
Figure 8 Effects of HIF-1α and GLUT-1 double gene knockout on PI3K/Akt/mTOR pathway detected by Western blots.
Notes: (A) The results of Western blot. (B) There was a significantly increased relative expression of PTEN and decreased p-PI3K, PI3K, p-AKT, AKT, and mTOR protein after HIF-1α and GLUT-1 double gene knockout compared with before HIF-1α and GLUT-1 double gene knockout (P=0.008, P=0.005, P=0.03, P=0.001, P=0.029, and P=0.007, respectively).