Figures & data
Table 1 Datasets of ZHX family members in breast cancer (Oncomine database)
Figure 1 Transcriptional levels of ZHX family members in different cancer types and cancer cell lines.
Notes: This graphic was obtained from Oncomine (www.oncomine.org) indicates the numbers of datasets with significant overexpression (red) or downexpression (blue) of ZHXs at transcriptional levels in cancer tissues compared with those in corresponding normal tissues. Cell color was determined by the best gene rank percentile for the analyses within the cell, and the gene rank was analyzed by the percentile of target genes in the top of all genes measured in each research.
Abbreviation: CNS, central nervous system.
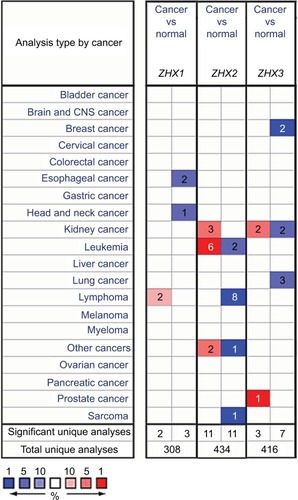
Figure 2 ZHXs were distinctively highly expressed in breast cancer cell lines from Cancer Cell Line Encyclopedia analysis.
Notes: The mRNA expression levels of ZHX1 (A), ZHX2 (B) and ZHX3 (C) in breast cancer cells, ranks in the 9th, 7th and 17th among all cancer cell types (shown in red frame).
Abbreviations: CML, chronic myelocytic leukemia; NSC, non-small cell; DLBCL, diffuse large B cell lymphoma; AML, acute myelocytic leukemia; NA, not applicable.
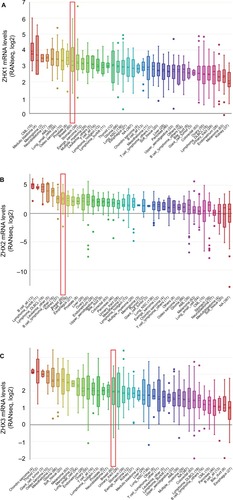
Table 2 Datasets of ZHX family in breast cancer from bc-GenExMiner v4.1
Figure 3 Correlation of mRNA expression of ZHX factors with SBR grade status.
Notes: Global significant differences of ZHX1 (A), ZHX2 (B) and ZHX3 (C) between groups were assessed by Welch’s test to generate P-values, along with Dunnett– Tukey–Kramer’s tests for pairwise comparison when a global significant difference exists.
Abbreviation: SBR, Scarff, Bloom and Richardson.
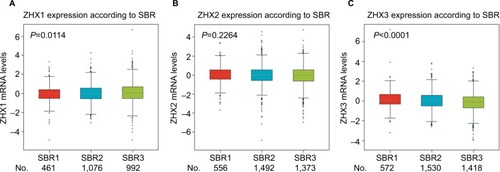
Figure 4 Prognostic value of mRNA levels of ZHX factors in breast cancer patients (OS and RFS in Kaplan–Meier plot).
Notes: The impact of ZHX1 (A), ZHX2 (B) and ZHX3 (C) on OS of breast cancer patients. (D) The impact of ZHX3 on RFS of breast cancer patients. (E) The impact of ZHX2 on OS in luminal A subtype. (F) The impact of ZHX3 on OS in luminal A subtype.
Abbreviations: OS, overall survival; RFS, relapse-free survival.
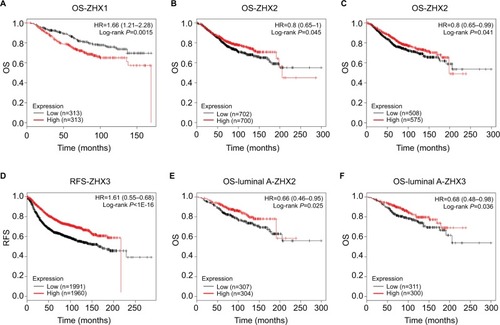
Figure 5 Genetic alterations of ZHX gene expression and their association with patient survival in breast invasive carcinoma (cBioPortal).
Notes: (A) Oncoprint in cBioPortal represented the proportion and distribution of samples with alterations in ZHX factors. The figure was cropped on the right to exclude samples without alterations. (B–D) Kaplan–Meier plots comparing OS in cases with/without ZHX1 (B), ZHX2 (C) and ZHX3 (D) alterations. (E–G) Kaplan–Meier plots comparing DFS in cases with/without ZHX1 (E), ZHX2 (F) and ZHX3 (G) alterations.
Abbreviations: DFS, disease-free survival; OS, overall survival; TCGA, The Cancer Genome Atlas.
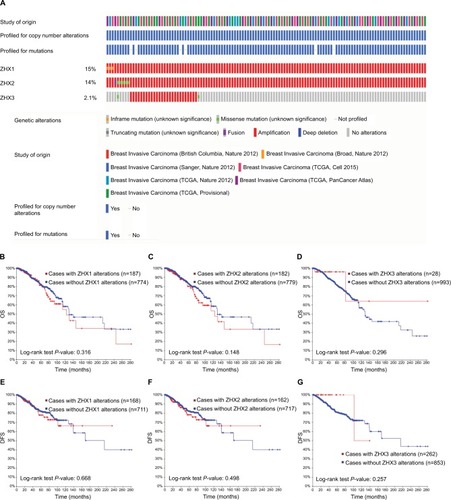
Table 3 Associations between ZHX3 expression and clinicopathological features in breast cancer
Table 4 Univariate and multivariate Cox proportional hazard model for the survival of breast cancer patients
Figure 6 ZHX3 protein levels were determined by Western blot analysis in primary breast cancer tissues (C) vs matching adjacent noncancerous tissues (N).
Notes: A quantitative analysis of ZHX3 expression normalized by β-actin is shown in the right panel (n=20). **P<0.01.
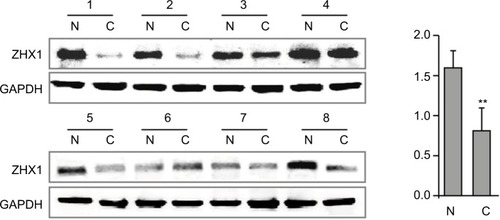
Figure 7 Representative immunohistochemical staining for ZHX3 in breast cancer.
Notes: (A) Strong staining of ZHX3 in breast cancer tissue. (B) Moderate staining of ZHX3 in breast cancer tissue. (C) Weak staining of ZHX3 in breast cancer tissue. Original magnification, ×400.
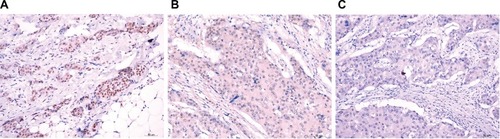
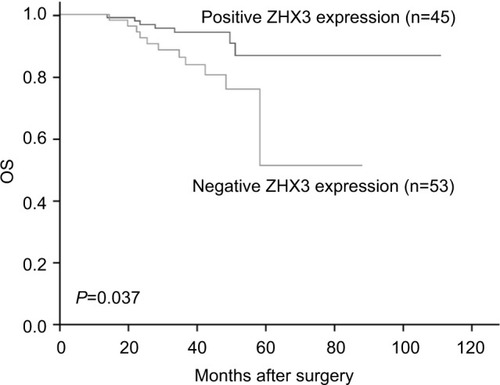
Figure 8 Kaplan–Meier survival curves with univariate analyses (log-rank) according to the expression status of ZHX3 in patients with breast cancer.
Note: The OS of patients with ZHX3-positive tumors was significantly higher than that of patients with ZHX3-negative tumors (P=0.037).
Abbreviation: OS, overall survival.