Figures & data
Table 1 Main characteristics of 26 studies after screening
Figure 1 Flowchart of the study selection process.
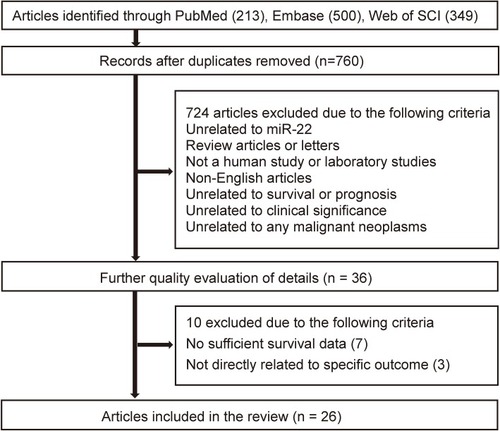
Figure 2 Forest plot of miR-22 expression and overall survival in various cancers.
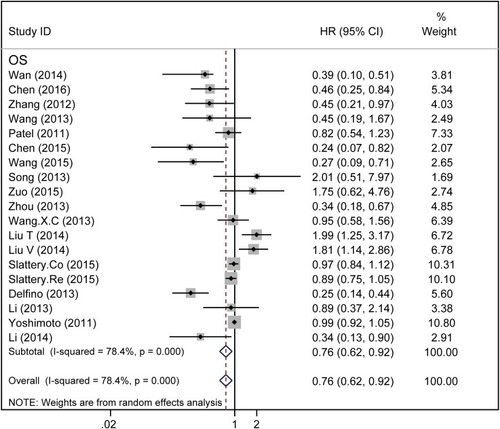
Table 2 Meta-analysis of overall and subgroup analysis for miR-22 expression and OS in cancers
Figure 3 Forest plot of subgroup analysis for OS: (A) subgroup analysis for the anatomy system of cancer (digestive system and reproduction system); (B) subgroup analysis for the main pathological type of cancer; (C) subgroup analysis for different sample type (tissue or serum); (D) subgroup analysis for different assay method for miR-22 expression (q-PCR and ISH).
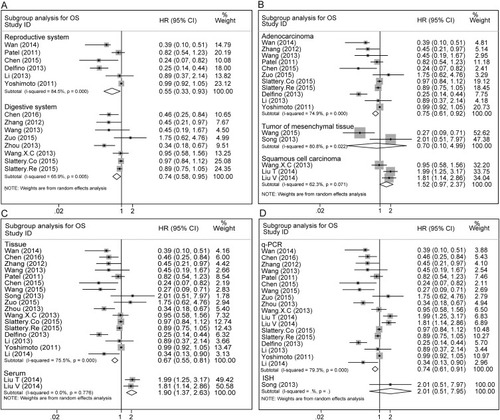
Table 3 Meta-analysis of overall and subgroup analysis for miR-22 expression and disease progress in cancers
Figure 4 Forest plot of miR-22 expression and disease progress: (A) subgroup analysis for PFS/DFS/RFS and MFS/DMFS; (B) subgroup analysis for different indicator type (PFS, DFS, RFS); (C) subgroup analysis for PFS/DFS/RFS in EOC subgroup.
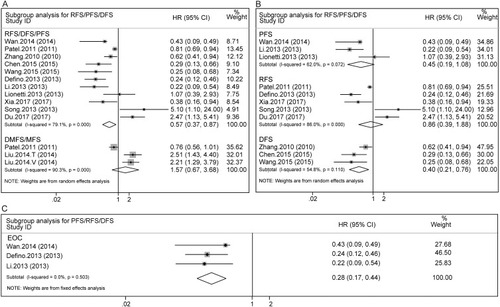
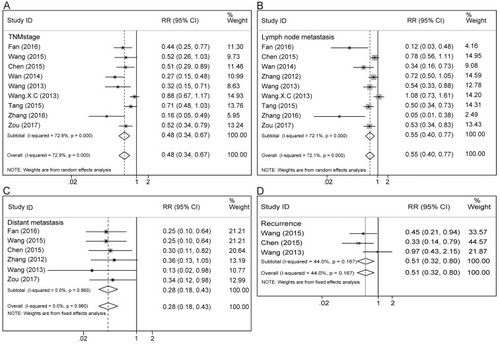
Figure 5 Forest plot of miR-22 expression and clinicopathological features. (A) subgroup analysis for miR-22 expression and TNM stage; (B) subgroup analysis for miR-22 high expression and lymph node metastasis; (C) subgroup analysis for miR-22 high expression and distant metastasis; (D) subgroup analysis for miR-22 high expression and recurrence.
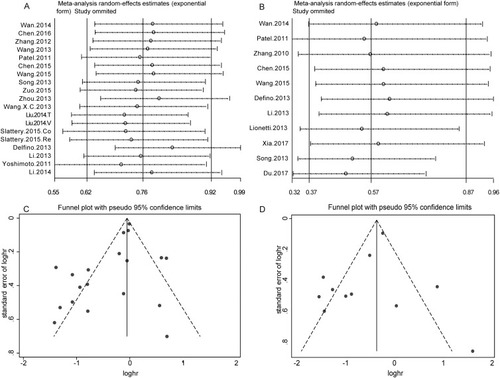
Table 4 Meta-analysis of miR-22 high expression and clinicopathological features
Figure 6 Sensitivity analysis and publication bias analysis under a specific model. (A), sensitivity analysis for overall survival; (B) sensitivity analysis for disease progress (PFS/RFS/DFS); (C) funnel plot of publication bias for OS; (D) funnel plot of publication bias for disease progress (PFS/RFS/DFS).