Figures & data
Figure 1 DEGs in five GEO datasets.
Notes: The figure shows 389 downregulated (A) and 556 upregulated (B) genes in PC samples. (C) GO biological process analysis for the DEGs. (D) KEGG pathway enrichment analysis for the DEGs. Set size refers to the number of genes differentially expressed between tumor and non-tumor samples in different GEO datasets.
Abbreviations: DEGs, differentially expressed genes; GO, Gene ontology; KEGG, Kyoto Encyclopedia of Genes and Genomes; PC, pancreatic cancer.
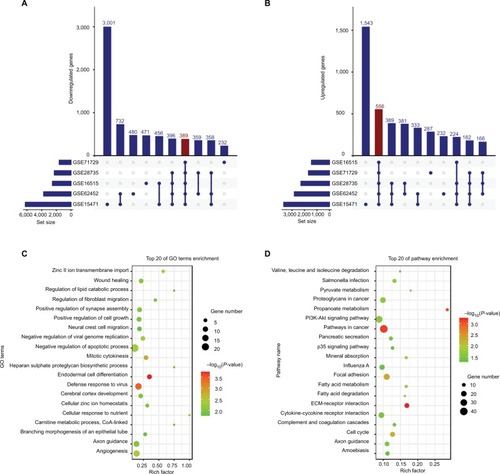
Figure 2 Relationship between SRGs and clinicopathological information.
Notes: (A) The Venn diagram shows four SRGs in four datasets. (B) Relationship between SRGs and tissues types. (C, D) Relationship between SRGs and histological grade. (E) Relationship between SRGs and PT. (F) Relationship between SRGs and tumor subtype. Other, including neuroendocrine carcinoma, colloid carcinomas, acinar cell carcinoma, and adenocarcinoma not otherwise specified.
Abbreviations: M, metastatic samples; N, normal samples; PDAC, pancreatic ductal adenocarcinoma; PT, the extent of the tumor; SRGs, survival-related genes; T, tumor samples.
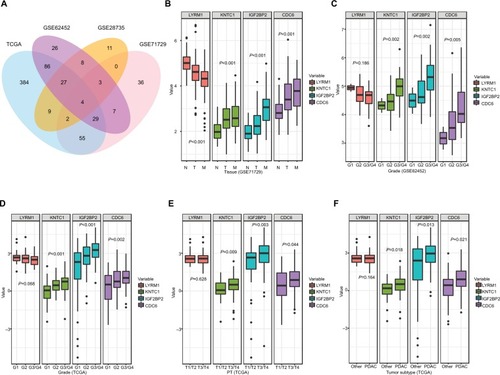
Figure 3 Survival analysis of SRGs in four datasets.
Notes: Survival curves of LYRM1 (A1–4), KNTC1 (B1–4), IGF2BP2 (C1–4), and CDC6 (D1–4) in GSE28735, GSE62452, GSE71729, and TCGA datasets.
Abbreviations: SRGs, survival-related genes; TCGA, The Genome Cancer Atlas.
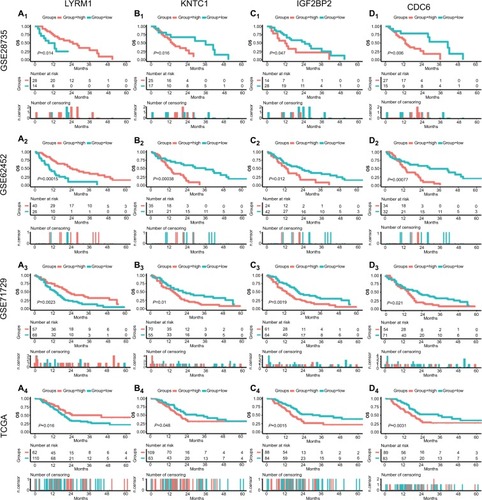
Figure 4 Performance of risk score in predicting prognosis in four datasets.
Notes: Survival curves, AUC, and calibration plots for risk score in TCGA (A1–3), GSE71729 (B1–3), GSE62452 (C1–3), and GSE28735 (D1–3).
Abbreviations: AUC, area under the curve; TCGA, The Genome Cancer Atlas.
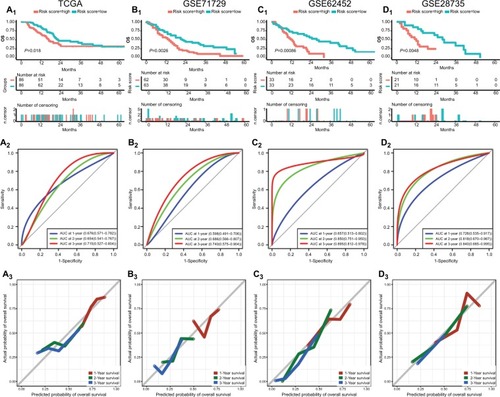
Table 1 Cox regression analysis of risk factors associated with overall survival in the TCGA dataset
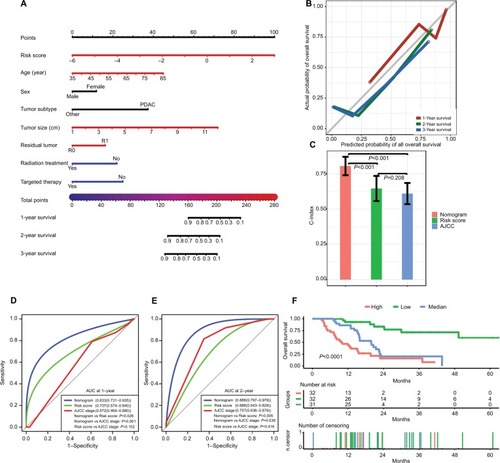
Figure 5 Performance of the nomogram in predicting prognosis in the TCGA dataset.
Notes: (A) Nomogram for predicting 1-, 2-, and 3-year OS in PC patients. (B) Calibration plot for 1-, 2-, and 3-year OS of the nomogram. (C) Comparison of the predictive power of the nomogram model, AJCC stage, and risk score, as assessed using C-index. (D, E) Comparison of the predictive power of the nomogram model, AJCC stage, and risk score by AUC at 1 and 2 years. (F) Kaplan–Meier analysis of risk groups stratified using total point of the proposed nomogram. Other, including neuroendocrine carcinoma, colloid carcinomas, acinar cell carcinoma, and adenocarcinoma not otherwise specified; vertical bars, 95% CI.
Abbreviations: AJCC, the American Joint Committee on Cancer; AUC, area under the curve; C-index, concordance index; OS, overall survival; PC, pancreatic cancer; PDAC, pancreatic ductal adenocarcinoma; TCGA, The Genome Cancer Atlas.