
Figures & data
Figure 1 Flow diagram showing study retrieval and selection process.
Abbreviations: CRC, colorectal cancer; GPS, Glasgow prognostic score; mGPS, modified Glasgow prognostic score.
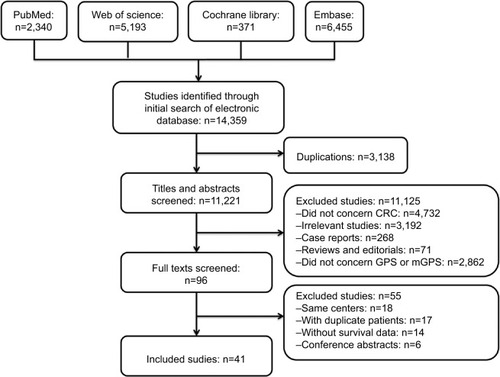
Table 1 Characteristics of included studies
Figure 2 Subgroup analysis showing correlation between GPS and prognosis of CRC patients according to models.
Note: (A) Overall survival and (B) cancer-specific survival.
Abbreviations: CRC, colorectal cancer; df, degrees of freedom; GPS, Glasgow prognostic score; mGPS, modified Glasgow prognostic score; LG, low group; HG, high group; SE, standard error.
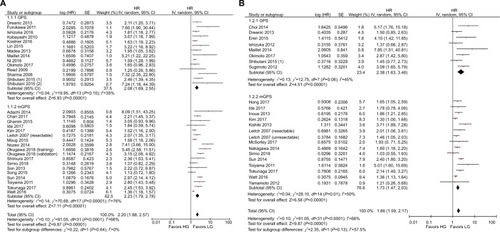
Figure 3 Subgroup analysis showing correlation between GPS and prognosis of CRC patients according to therapeutic strategies.
Note: (A) Overall survival and (B) cancer-specific survival.
Abbreviations: CRC, colorectal cancer; df, degrees of freedom; GPS, Glasgow prognostic score; LG, low group; HG, high group; SE, standard error.
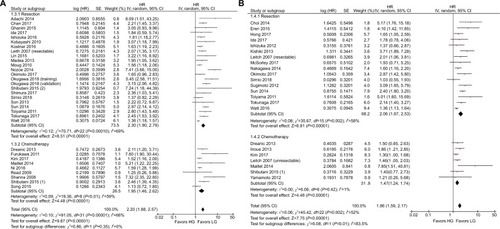
Figure 4 Subgroup analysis showing correlation between GPS and prognosis of CRC patients according to cutoff values.
Note: (A) Overall survival and (B) cancer-specific survival.
Abbreviations: CRC, colorectal cancer; df, degrees of freedom; GPS, Glasgow prognostic score; LG, low group; HG, high group; SE, standard error.
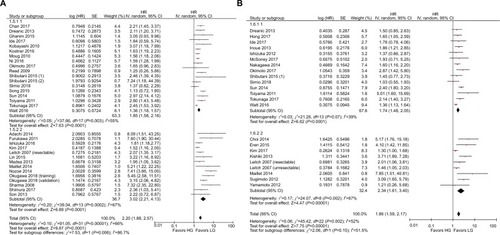
Figure 5 Subgroup analysis showing correlation between GPS and prognosis of CRC patients according to the region of publication.
Note: (A) Overall survival and (B) cancer-specific survival.
Abbreviations: CRC, colorectal cancer; df, degrees of freedom; GPS, Glasgow prognostic score; LG, low group; HG, high group; SE, standard error.
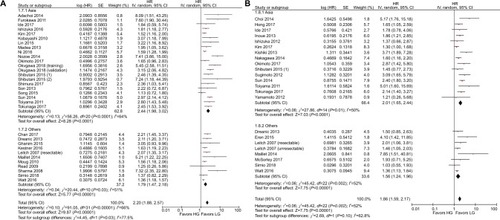
Figure 6 Subgroup analysis showing correlation between GPS and prognosis of CRC patients according to patient age.
Note: (A) Overall survival and (B) cancer-specific survival.
Abbreviations: CRC, colorectal cancer; df, degrees of freedom; GPS, Glasgow prognostic score; LG, low group; HG, high group; SE, standard error.
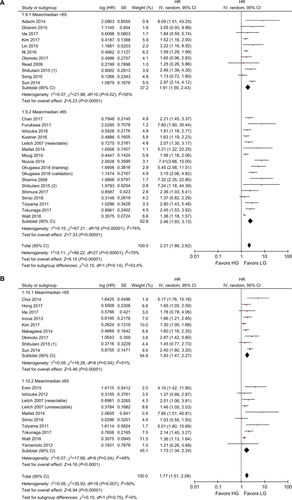
Figure 7 Subgroup analysis showing correlation between GPS and prognosis of CRC patients according to sample size.
Note: (A) Overall survival and (B) cancer-specific survival.
Abbreviations: CRC, colorectal cancer; df, degrees of freedom; GPS, Glasgow prognostic score; LG, low group; HG, high group; SE, standard error.
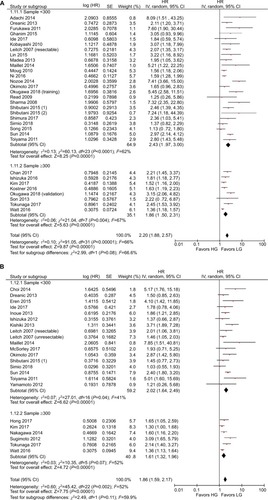
Figure 8 Subgroup analysis showing correlation between GPS and prognosis of CRC patients according to TNM stages.
Note: (A) Overall survival and (B) cancer-specific survival.
Abbreviations: CRC, colorectal cancer; df, degrees of freedom; GPS, Glasgow prognostic score; LG, low group; HG, high group; SE, standard error; TNM, tumor, node, metastases.
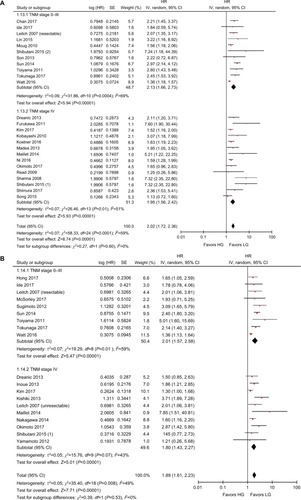
Figure 9 Sensitivity analysis and funnel plot of OS of patients with CRC.
Notes: Sensitivity analysis for (A) overall patients focusing on OS and (B) patients after removing studies with potential publication bias. Funnel plot for (C) overall patients focusing on OS and (D) patients after removing studies with potential publication bias.
Abbreviations: CRC, colorectal cancer; OS, overall survival; SE, standard error.
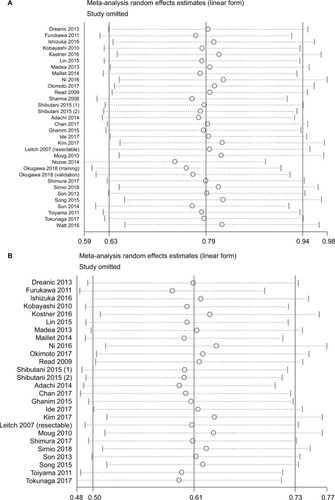
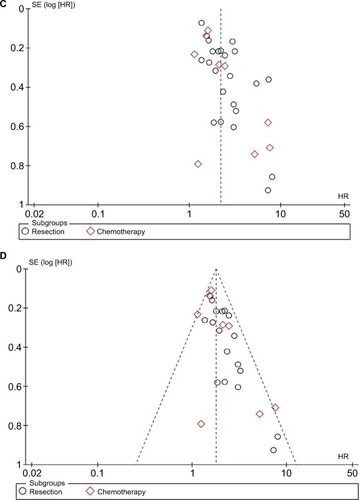
Table 2 Results of subgroup analyses of overall survival and cancer-specific survival
Table S1 Summary of risk of bias