
Figures & data
Figure 1 Structures of compounds 1–16.
Note: The structure of all compounds was tested using NMR spectral data analysis. Abbreviation: NMR, nuclear magnetic resonance.
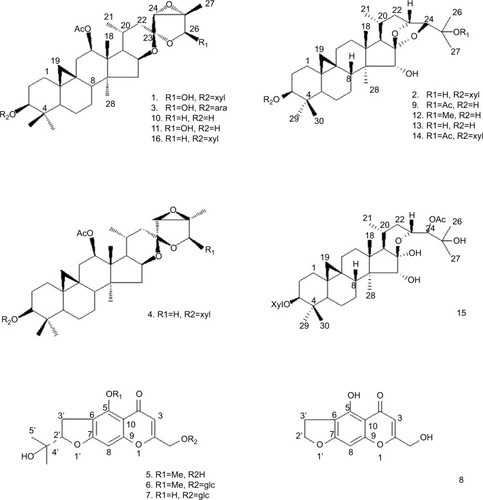
Table 1 IC50 values of compounds 1–16 on breast cancer cells, MCF-7, MDA-MB-231, or Sk-Br3
Figure 2 Compound 4 or 13 inhibited the subcutaneous growth of MDA-MB-231 cells.
Notes: MDA-MB-231-H cells were injected into nude mice to form subcutaneous tumors. Next, mice were divided into four groups: 1) solvent control group; 2) compound 4 group; 3) compound 13 group; (4) adriamycin group. Results are shown as follows: (A) photographs, (B) tumor volumes, and (C) tumor weights. *P<0.05.
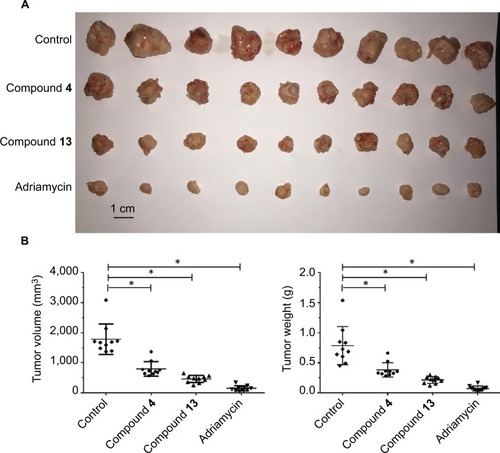
Figure 3 Compound 4 or 13 inhibited the in vitro invasion of MDA-MB-231 cells.
Notes: MDA-MB-231 cells were treated with IC50 of compound 4, compound 13, or adriamycin for 24 hours. Then, the cells were harvested for transwell experiments to reveal the in vitro invasion of MDA-MB-231 cells. Results are shown as follows: (A) photographs, (B) relative invasion number, or (C) inhibition rate of compound 4, compound 13, or adriamycin on MDA-MB-231’s in vitro invasion. *P<0.05.
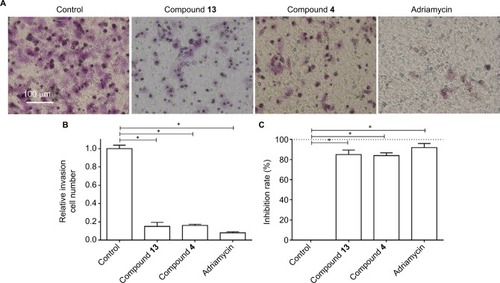
Figure 4 Compound 4 or 13 inhibited the in vitro migration growth of MDA-MB-231 cells.
Notes: MDA-MB-231 cells were treated with IC50 of compound 4, compound 13, or adriamycin for 24 hours. Then, the cells were harvested for transwell experiments to reveal the in vitro migration of MDA-MB-231 cells. Results are shown as follows: (A) photographs, (B) relative migration number, or (C) inhibition rate of compound 4, compound 13, or adriamycin on MDA-MB-231’s in vitro migration. *P<0.05.
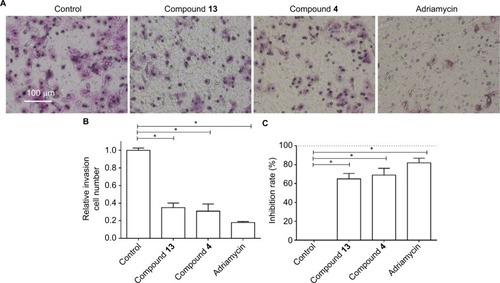
Figure 5 Compound 4 or 13 inhibited the MicroPET signaling mice with the intrahepatic growth of MDA-MB-231 cells in the liver region.
Notes: MDA-MD-231 cells were injected into nude mice’s liver via hepatic portal vein. Next, the mice were divided into four groups: 1) solvent control group; 2) compound 4 treatment group; 3) compound 13 treatment group; 4) adriamycin treatment group. The tumor nodules formed by MHCC97-H cells in mice’s liver were examined by MicroPET scanning. Results are shown as follows: (A) MicroPET results from animals, (B) pixel ratio of tumor to body, or (C) intensity of tumor to body. Arrow indicates the tumor tissues in the liver. *P<0.05.
Abbreviation: PET, positron emission tomography.
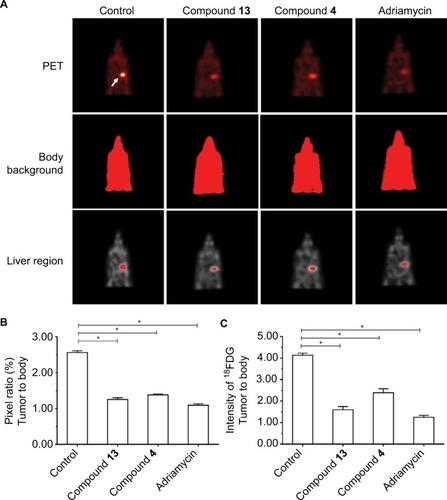
Figure 6 Compound 4 or 13 inhibited the intrahepatic growth of MDA-MB-231 cells.
Notes: MDA-MD-231 cells were injected into nude mice’s liver via hepatic portal vein. Next, mice were divided into four groups: 1) solvent control group; 2) compound 4 treatment group; 3) compound 13 treatment group; 4) adriamycin treatment group. The tumor nodules formed by MHCC97-H cells in the mice’s liver were examined by MicroPET scanning. After MicroPET scanning, the liver organs in mice were harvested. Results are shown as follows: (A) tumor organs or (B) radioactivation of tumor tissue to blood or (C) relative nodule formed by MDA-MB-231 cells in the liver organ. White arrow in indicated the nodules formed by MDA-MB-231 cells in nude mice’s liver organ.*P<0.05.
Abbreviation: PET, positron emission tomography.
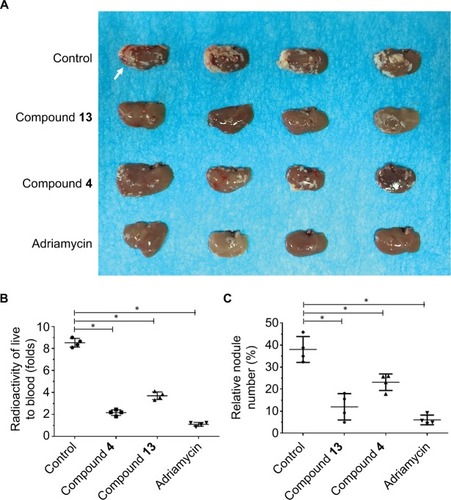
Figure S1 HPLC results of compounds 1–16.
Note: All compounds were examined by HPLC to achieve quality control of the chemicals.
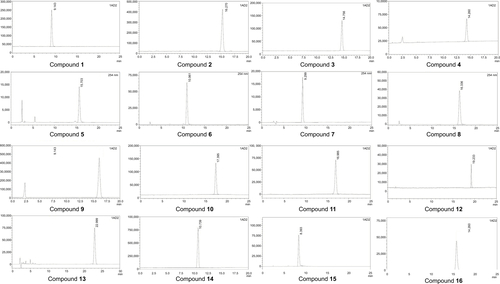
Table S1 Chemical structure of compounds 1–16