Figures & data
Figure 1 FOXM1 mRNA expression is upregulated in human CRC tissues and positively correlated with β-catenin expression.
Notes: (A and B) The relative mRNA expression levels of FOXM1and β-catenin were determined by qRT-PCR and normalized against β-actin control. Paired two-sample t-tests were used to compare the mean value for each gene between the tumor tissues and corresponding NATs. P<0.001 or P<0.0001 was considered significant. (C) A significant positive correlation was found between FOXM1 and β-catenin mRNA expression in colorectal tumor tissues (R2=0.664, P<0.0001). (D) Protein expression of FOXM1 and β-catenin was determined by western blot analysis in colorectal tumor (T) and corresponding NATs (N) from four individual patients. β-actin served as an internal control.
Abbreviations: CRC, colorectal cancer; NATs, normal-appearing tissues; qRT-PCR, quantitative RT-PCR.
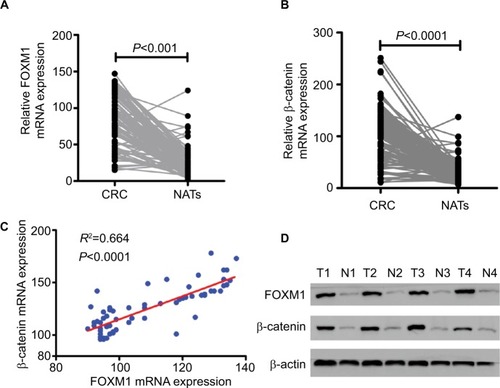
Table 1 The expression of FOXM1 and β-catenin in 124 CRCs and NATs
Table 2 Correlation between the expression of FOXM1 and β-catenin with clinicopathological parameters in colorectal carcinomas
Table 3 The relationship of FOXM1 and β-catenin in colorectal carcinomas
Figure 2 Expression of FOXM1 protein and mRNA in colon cancer cells after transfection with pFOXM1 or si-FOXM1.
Notes: (A) DLD-1 cells were transfected with either untransfected (mock), pcDNA3.1 (control), or pFOXM1 plasmids. Western blots demonstrated that FOXM1 protein levels were significantly increased after transfection with pFOXM1. (B) The relative protein folds in DLD-1 after transfection with pFOXM1, *P<0.05. (C) Relative FOXM1 mRNA expression levels of DLD-1 cells were upregulated markedly after transfection with pFOXM1, **P<0.01. (D) HCT116 cells were transfected with either untransfected (mock), FOXM1 si-control, or si-FOXM1. Western blots demonstrated that FOXM1 protein levels were significantly reduced after transfection with si-FOXM1. (E) The relative protein folds in HCT116 after transfection with si-FOXM1. (F) Relative FOXM1 mRNA expression levels of HCT116 cells were decreased after transfection with FOXM1 siRNA which were quantified by real-time PCR (**P<0.01). β-actin was evaluated as an internal control. Data are presented as mean ± SD for at least three independent experiments. Statistical analysis was done using Student’s t-tests.
Abbreviations: pFOXM1, pcDNA3.1-FOXM1; si-control, control-siRNA; si-FOXM1, FOXM1 siRNA.
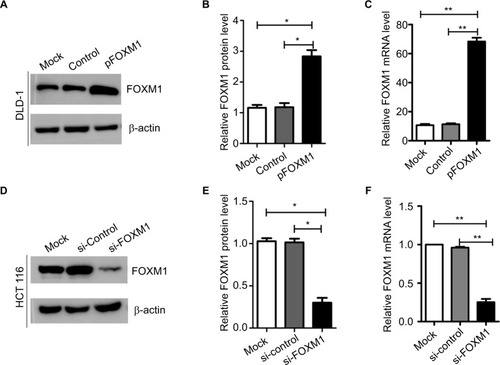
Figure 3 The proliferation and clonogencity of colon cancer cells after transfection with pFOXM1 or si-FOXM1.
Notes: (A and C) The results from MTT and colony formation assays show that upregulated FOXM1 expression by transfection with pFOXM1 significantly increased the cell proliferation and clonogencity of DLD-1 cells compared to those of control-transfected cells (*P<0.05, **P<0.01). (B and D) Conversely, downregulation of FOXM1 attenuated the proliferation and clonogencity of HCT116 cells after transfection with si-FOXM1 (**P<0.01, ***P<0.001). Data are shown as mean ± SD. Experiments were repeated three times.
Abbreviations: pFOXM1, pcDNA3.1-FOXM1; si-control, control-siRNA; si-FOXM1, FOXM1 siRNA.
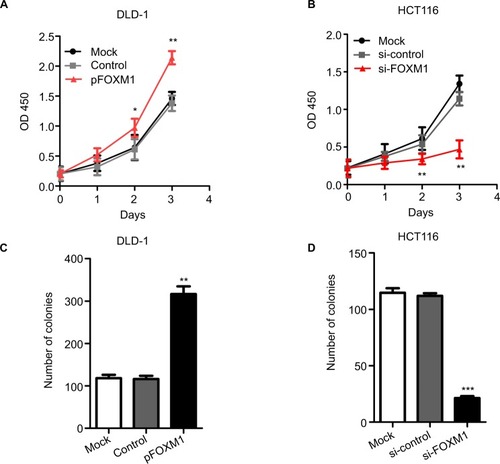
Figure 4 Impact of altered FOXM1 expression on colon cancer cell migration and invasion in vitro. DLD-1 and HCT116 cells were transfected with pFOXM1 and si-FOXM1, respectively.
Notes: (A) DLD-1 and (C) HCT116 cells migration and invasion were detected by the Transwell assays and were determined as described in Materials and Methods. Representative migrated or invaded colon cancer cells were photographed. (B and D) Statistical graphs show the relative number of migrated and invaded cells. Upregulated FOXM1 expression significantly promoted migration and invasion of DLD-1 cells. However, downregulated FOXM1 expression markedly suppressed the migration and invasion capacity of HCT116 cells. Data are shown as the mean ± SD. **P<0.01, ***P<0.001, compared with controls. Scale bar 200μm.
Abbreviations: pFOXM1, pcDNA3.1-FOXM1; si-control, control-siRNA; si-FOXM1, FOXM1 siRNA.

Figure 5 Effects of FOXM1 on the expressions of β-catenin target genes in CRC cells.
Notes: The protein and mRNA levels of β-catenin target genes, such as cyclin D1, TCF-4 and c-Myc, were measured using western blots and qRT-PCR analysis. (A–D) The mRNA expression of cyclin D1, TCF-4, and c-Myc was found to be increased significantly in FOXM1-overexpression DLD-1 cells compared to mock and control transfectants. *P<0.05, **P<0.01. (E–H) FOXM1 knocking down obviously downregulated the cyclin D1, TCF-4, and c-Myc mRNA expression levels in HCT116 cells after tranfection with si-FOXM1. **P<0.01, *P<0.05. All the results were measured at least three times.
Abbreviations: qRT-PCR, quantitative RT-PCR; si-control, control-siRNA; si-FOXM1, FOXM1 siRNA; TCF-4, T-cell factor-4; pFOXM1, pcDNA3.1-FOXM1.
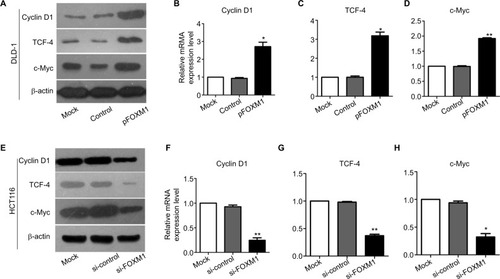
Figure 6 Influence of FOXM1 on β-catenin expression in nuclear and cytoplasm.
Notes: DLD-1 and HCT116 cells were transfected with FOXM1 plasmids or siRNAs for 48 hours. The expressions of β-catenin in nuclear and cytoplasm were examined by western blots. (A) Cytoplasmic and nuclear levels of β-catenin were examined in DLD-1 after transfection with FOXM1 plasmids. (B) Cytoplasmic and nuclear levels of β-catenin were examined in HCT116 after transfection with FOXM1 siRNAs. β-actin was used as the loading control for cytoplasmic protein. Lamin B1 was used as the loading control for nuclear proteins. Each experiment was repeated at least three times. **P<0.01.
Abbreviations: si-control, control-siRNA; si-FOXM1, FOXM1 siRNA.
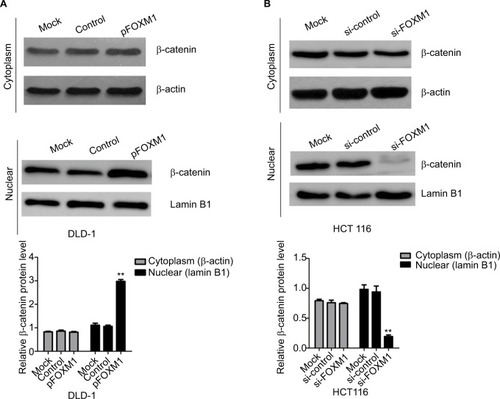
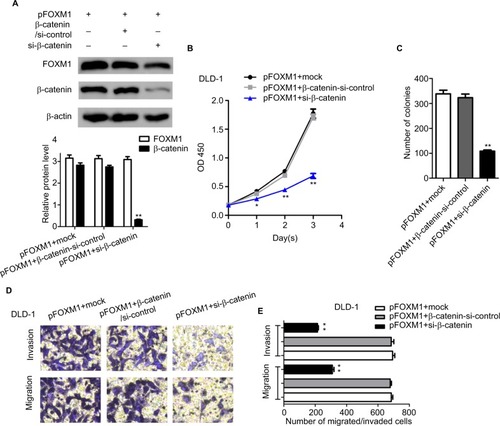
Figure 7 Silencing β-catenin rescued the FOXM1-induced tumorigenicity in CRC cells.
Notes: (A) DLD-1 overexpressing cells were subjected to transfection with mock or β-catenin-si-control or si-β-catenin. The protein expression levels of FOXM1 and β-catenin were detected by western blots. β-actin was an internal control. (B) MTT assays show that silencing of β-catenin in DLD-1 FOXM1-overexpressing cells could lead to significant inhibition of cell proliferation. (C) Downexpression of β-catenin significantly reduced the cell clonogencity of DLD-1 FOXM1-overexpressing cells compared with those of control-transfected cells. **P<0.01. (D and E) Transwell assays indicated that a significant decrease of migrated or invaded capability was also observed in DLD-1 FOXM1-overexpressing cells with β-catenin silencing. Each experiment was repeated at least three times. *P<0.05, **P<0.01, **P<0.001, compared to control-siRNA and untreated group. Scale bar 100μm.
Abbreviations: CRC, colorectal cancer; pFOXM1, pcDNA3.1-FOXM1; si-control, control-siRNA; si-FOXM1, FOXM1 siRNA.