
Figures & data
Table 1 Clinicopathological characteristics of all the included patients
Table 2 Univariate and multivariable analyses for LRC
Figure 1 Kaplan–Meier analysis of local–regional control of patients with/without radiotherapy (Log-rank tests: χ2=25.394, P=0.000).
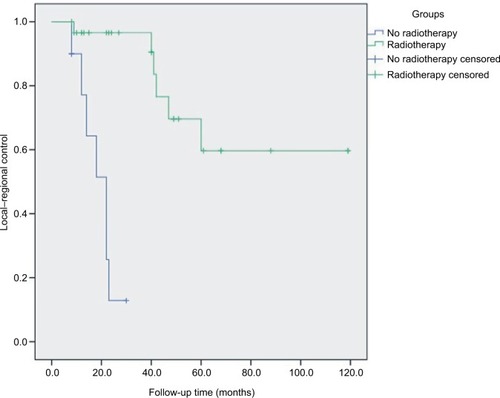
Table 3 Univariate and multivariable analyses for DDFS
Figure 2 Kaplan–Meier analysis of distant disease-free survival of patients with/without radiotherapy (Log-rank tests: χ2=0.191, P=0.662).
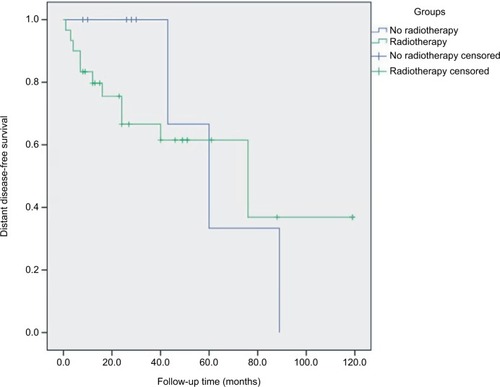
Table 4 Treatment and prognosis of patients with gross residual disease