
Figures & data
Figure 1 Scheme of this study.
Abbreviations: ORR, objective response rate; OS, overall survival; PFS, progression-free survival.
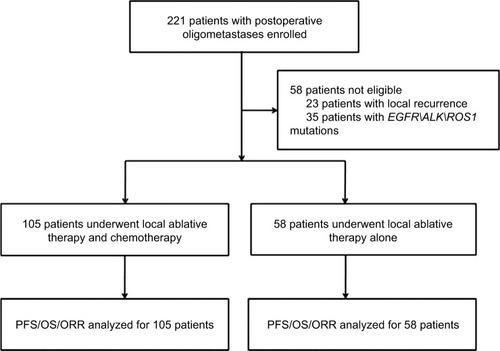
Table 1 Characteristics of patients
Figure 2 Kaplan–Meier curves of OS (A) and PFS (B) for the local ablative therapy with or without chemotherapy in NSCLC patients with postoperative oligometastases.
Abbreviations: NSCLC, non-small-cell lung cancer; OS, overall survival; PFS, progression-free survival.
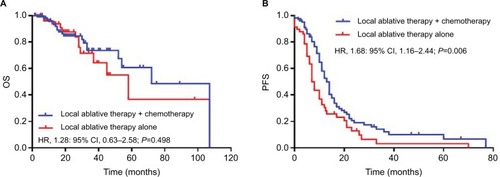
Table 2 Univariate and multivariate analyses of overall survival
Table 3 Univariate and multivariate analyses of progression-free survival
Table 4 ORR and patterns of failure
Table 5 Treatment toxicities