
Figures & data
Table 1 Baseline characteristics of the study group (n=206)
Table 2 BRCA1 germline mutations in the breast and/or ovarian cancer group
Figure 1 Mutational spectrum of BRCA genes in the breast and/or ovarian cancer group.
Notes: Pie chart depicting (A) exonic distribution of the distinct BRCA1 mutations (an=31). (B) Number of different types of Class 5, Class 4 and Class 3 mutations observed in BRCA1 gene (n=33). (C) Exonic distribution of distinct BRCA2 mutations (n=16). (D) Number of different types of Class 5, Class 4 and Class 3 mutations observed in BRCA2 gene (n=16). (E) Bar graph comparing the number of different Class 4/5 mutations observed in BRCA1/BRCA2 genes (n=36). aDuplication (exons 21–23) and one intronic mutation have been excluded from the pie diagram.
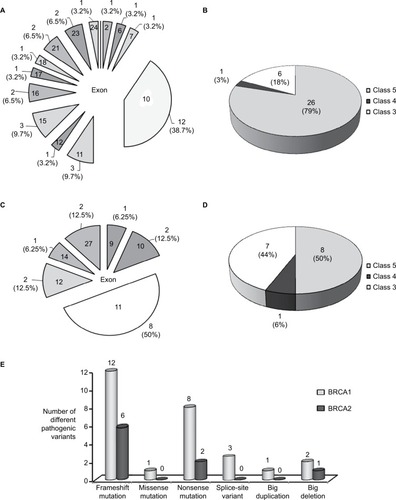
Table 3 BRCA2 germline mutations in the breast/ovarian cancer patients
Figure 2 Novel BRCA1/BRCA2 mutations identified in the cohort.
Notes: Lollipop plots showing the distribution of germline mutations in (A) BRCA1 and (B) BRCA2 genes. Predicted amino acid change has been represented for each mutation. The plots were generated using the online tool MutationMapper – cBioPortal for Cancer GenomicsCitation31,Citation32 (GenBank Reference BRCA1: NM_007300 and GenBank Reference BRCA2: NM_000059).
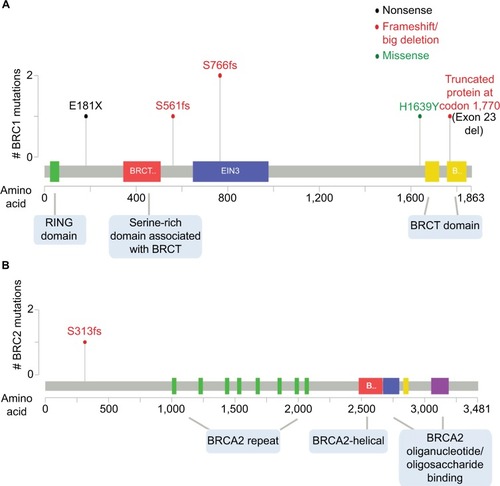
Table 4 Recurrent BRCA1/BRCA2 gene mutations observed in the study cohort
Table 5 Correlation between BRCA mutation status and prognostic markers/tumor histopathology