Figures & data
Figure 1 LSD1 is high expression in GC tissues and cell lines
Notes: (A) Expression of LSD1 in GC and adjacent normal tissues by RT-qPCR and Western blotting analyses, *P<0.05, vs normal tissues. (B) Expression of LSD1 in GC cell lines MKN-45 and HGC-27 as well as normal gastric cell line GES-1 by RT-qPCR and Western blotting analyses, *P<0.05, vs GES-1. (C) Kaplan–Meier followed by log-rank analysis was used to analyze the correlation of LSD1 expression and survival rate of GC patients, *P<0.05.
Abbreviations: LSD1, lysine-specific demethylase 1; GC, gastric cancer; RT-qPCR, reverse transcription-quantitative PCR.
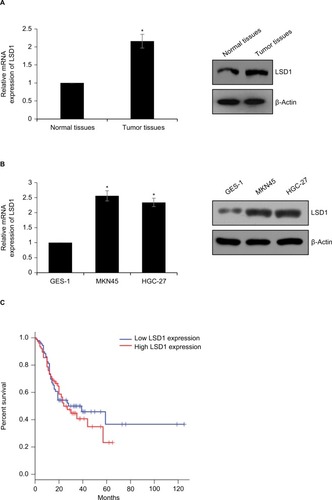
Table 1 Clinic pathologic variables in 64 GC patients
Figure 2 Upregulation of LSD1 promotes GC cell proliferation in vitro.
Notes: (A) and (B) LSD1 was overexpressed or knocked down in MKN-45 or HGC-27 cells. After transfection for 48 hours, the expression of LSD1 was determined using RT-qPCR or western blotting analyses. *P<0.05, vs vector, **P<0.05, vs SCR. (C) Colony formation assay was performed to determine the effects of LSD1 on cell proliferation. *P<0.05, vs vector, **P<0.05, vs SCR. Scar bar =250 μm. (D) CCK-8 assay was performed to determine the effects of LSD1 on cell proliferation. *P<0.05, vs vector, **P<0.05, vs SCR.
Abbreviations: CCK-8, cell-counting kit-8; GC, gastric cancer; LSD1, lysine-specific demethylase 1.
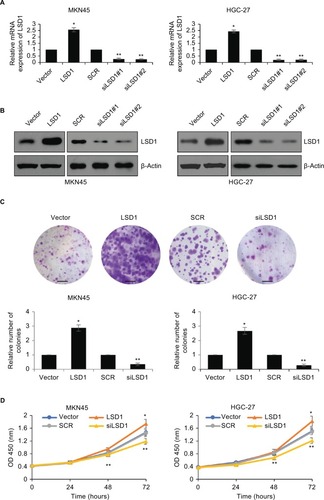
Figure 3 Upregulation of LSD1 promotes GC cell migration and invasion in vitro.
Notes: (A) LSD1 was overexpressed or knocked down in MKN-45 and HGC-27 cells. Representative images were captured at 0 and 24 hours to assess the cell migration into the wound space (magnification ×20). *P<0.05, vs vector, **P<0.05, vs SCR. (B) MKN-45 and HGC-27 cells were transfected with pcDNA3.1-LSD1 plasmid or LSD1 siRNA, respectively. After transfection for 48 hours, Transwell invasion assay was performed. Representative images of the Transwell invasion assay following incubation for 24 hours (magnification ×20). Scar bar =250 μm. *P<0.05, vs vector, **P<0.05, vs SCR.
Abbreviations: GC, gastric cancer; LSD1, lysine-specific demethylase 1.
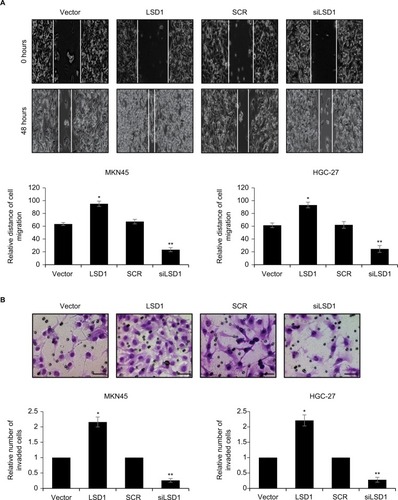
Figure 4 LSD1 induces EMT of GC cell lines.
Notes: (A) and (B) LSD1 was overexpressed or knocked down in MKN-45 or HGC-27 cells, the expression of E-cadherin was detected using RT-qPCR and western blotting assay. *P<0.05, vs vector, **P<0.05, vs SCR.
Abbreviations: EMT, epithelial-mesenchymal transition; GC, gastric cancer; LSD1, lysine-specific demethylase 1.
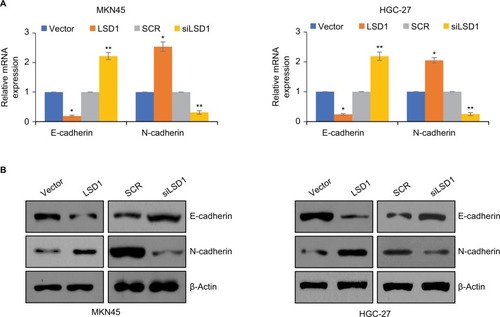
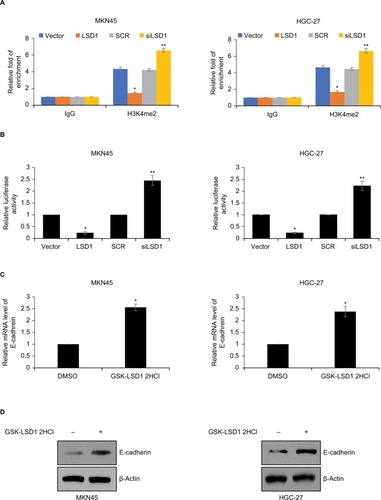
Figure 5 LSD1 transcriptionally regulates E-cadherin through demethylation of H3K4me2 in GC cells.
Notes: (A) LSD1 was overexpressed or knocked down in MKN-45 or HGC-27 cells, ChIP and qChIP assays were performed using anti-H3K4me2 or anti-IgG antibodies. *P<0.05, vs vector, **P<0.05, vs SCR. (B) LSD1 was overexpressed or knocked down in MKN-45 or HGC-27 cells, dual luciferase reporter assays were performed. *P<0.05, vs vector, **P<0.05, vs SCR. (C) and (D) MKN-45 or HGC-27 cells were treated with DMSO or 5 nM GSK-LSD1 2HCl. After incubation for 48 hours, the expression of E-cadherin was detected using RT-qPCR and Western blotting analyses. *P<0.05, vs vector, **P<0.05, vs SCR.
Abbreviations: ChIP, chromatin immunoprecipitation; GC, gastric cancer; LSD1, lysine-specific demethylase 1; qChIP, quantitative chromatin immunoprecipitation.