Figures & data
Figure 1 Predictive features on CT imaging as assessed: (A and B) exophytic properties; (C) necrosis and well-defined tumor contour; (D) ill-defined tumor contour; and (E) collecting system oppression.
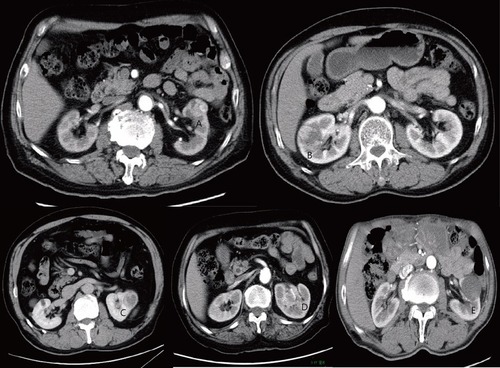
Table 1 Demographic and histopathological information on development and validation cohort
Table 2 Characteristics of patients in the development and validation cohort
Table 3 Risk features for high-grade small renal mass
Figure 2 Feature selection on the basis of the least absolute shrinkage and selection operator (LASSO) binary logistic regression model. (A) The tuning parameter (λ) in the LASSO model was chosen to be 10 cross-validations with a minimum standard. The area under the receiver operating characteristic (AUC) curve was plotted versus log (λ). By using the minimum standard and the 1 standard error of the minimum standard (1-SE standard), dotted vertical lines were drawn at the optimum value. The value of λ was 0.063 and the log (λ) was −2.76 (1-SE standard) according to 10-fold cross-validation. (B) LASSO coefficient profile for 14 features. A coefficient profile plot was generated for the log (λ) sequence. A vertical line was drawn at the value selected using 10-fold cross-validation, where the best (λ) resulted in 4 non-zero coefficients.
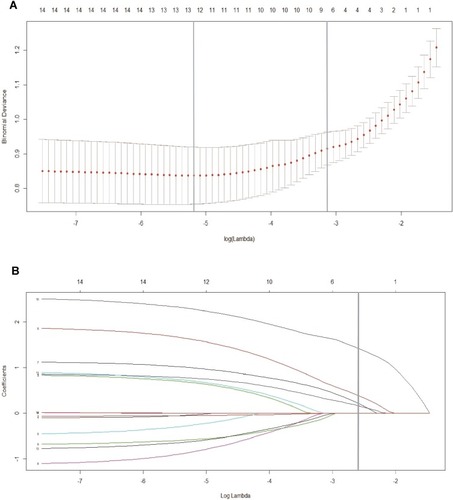
Figure 3 Nomogram for evaluating the risk of high-grade tumor histological subtype. Points were assigned by plotting a straight line from the proper spot on each predictor level up to the “Points” level; sum points achieved for each predictor and locate this sum on “Total Points” axis, then drawn a straight line down to determine the corresponding probability of high-grade tumor histological subtype.
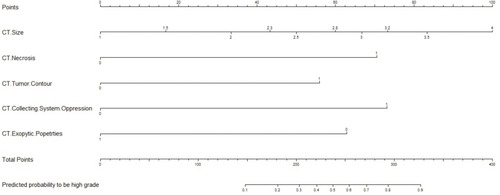
Figure 4 Calibration curves of the nomogram in the development (A) and validation (B) cohort. Calibration curves depict the calibration of final model based on the agreement between the predicted risk of high-grade histological subtype and the observed outcome of high-grade histological subtype. The solid line represents the performance of the nomogram, and the position which was closer to the diagonal dashed line represents a better prediction.
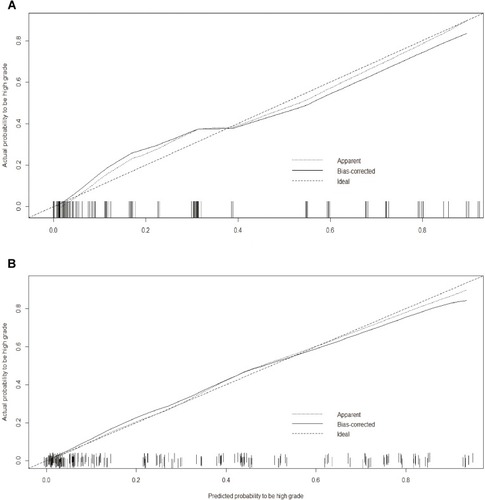
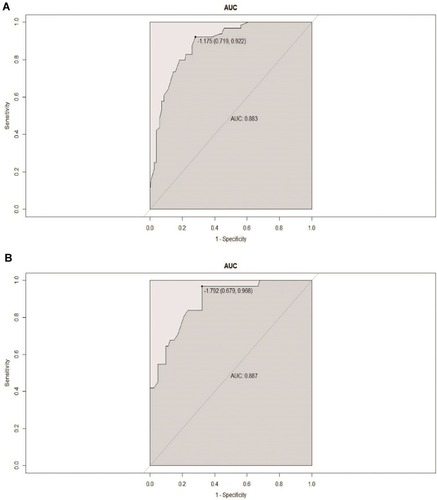
Figure 5 Receiver operator characteristics (ROC) curve developed from patients of development (A) and validation (B) cohort when nomogram was used to predict high-grade tumor vs low-grade tumor histological subtype.
Abbreviation: AUC, area under the curve.