
Figures & data
Figure 1 Structure of compounds (1–4).
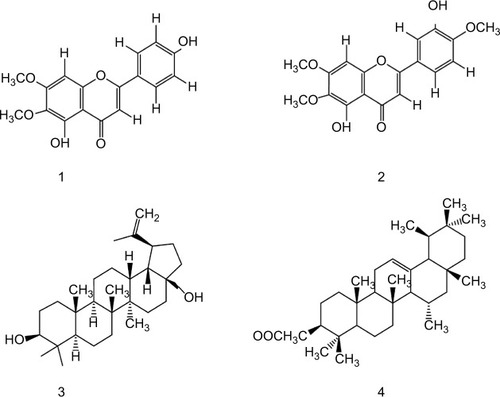
Figure 2 (A) Cytotoxic effects of betulin from Quercus incana against NSCLC and normal cells at various concentrations. *P<0.05 was considered as significant. **P<0.01; ***P<0.001. Morphological changes in (B) NCI-H460 cells (C) NIH-3t3 cells after 24 and 48 hours of treatment with betulin, observed under phase contrast microscope at 10× magnification. (D) Effect of betulin on colony formation of H460 cells after 48 hours treatment of betulin. Cells were supplied with fresh culture media every third day and were incubated at 37°C in humidified 5% CO2 environment for 15 days after the treatment. (E) Immunocytochemical analysis of expression of proliferative marker Ki-67 after 48 hours of treatment with betulin, observed under fluorescent microscope at 20× magnification.
Abbreviation: NSCLC, nonsmall cell lung cancer.
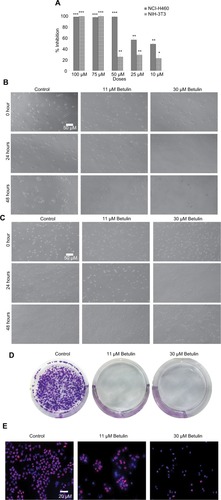
Table 1 IC50 values of the compounds from chloroform fraction of Quercus incana against NSCLC and normal cells
Figure 3 (A) Effects of betulin on the migration of NCI-H460 cells. Using phase contrast microscope at 10× magnification, scratch areas were photographed and area of the wound was calculated using Image J. (B) Percent closure of the wound after 24 and 48 hours of the treatment. In control well, the rate of migration of the cells toward the wound was increased to 41% after 48 hours in treated groups cells migration was significantly reduced. **P<0.01 vs control. *P<0.05; ***P<0.001. (C) Effects of betulin on invasion of NCI-H460 cells using transwell assay. Membrane was photographed under bright field at 4× magnification using inverted microscope. (D) Effects of betulin on expression levels of MMP-2 and -9 in NCI-H460 cells after 48 hours treatment as evaluated by RT-PCR. (E) Gelatinolytic activity of MMP-2/-9 in response to the treatment with different concentrations of betulin as analyzed by zymography.
Abbreviation: MMP, matrix metalloproteinases.
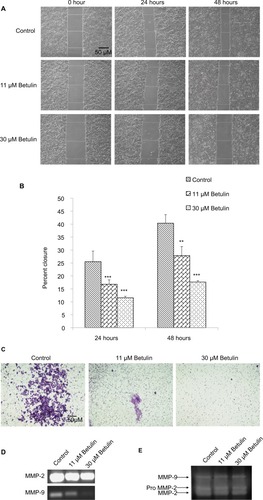
Figure 4 (A) Betulin (3) induced apoptosis in NSCLC cell line in a dose-dependent manner. Flow cytometric analysis of the apoptosis induced by the indicated concentrations of the compound. An increased number of cells were observed in treated groups compared to control. (B) Graphical representation of the cells in different phases of apoptosis after 48 hours of treatment. **P<0.01 compared to the untreated control. ***P<0.001. (C) Effects of betulin (3) on the mitochondrial membrane potential (Δψm) of the cells after 48 hours. Following the treatment with different concentrations, an increase in positive green fluorescent cells was observed, indicating loss of Δψm compared to the control. (D) Histogram shows the percentages of the cells with disrupted Δψm in treated groups. ***P<0.001 vs the untreated control. (E) Effects of betulin (3) on the nuclear morphology of NCI-H460 cells. Increase in DNA condensation and change in the shape of the nucleus of the treated groups have been observed in a dose and time-dependent manner compared to the control.
Abbreviation: NSCLC, nonsmall cell lung cancer.
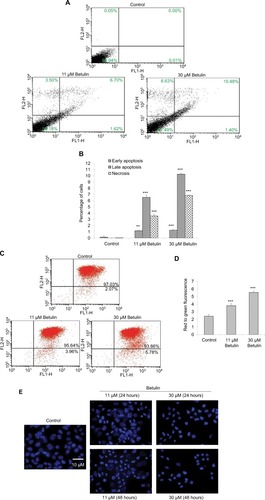
Figure 5 (A) Analysis of effects of the compounds on the mRNA expression of cell survival and apoptotic genes. An upregulation was observed in genes of caspases family and proapoptotic genes ie, HRK, BAX and BAK, while anti-apoptotic BCL-2L1 and p53 genes and cell survival VEGF and COX-2 genes significantly downregulated. Interestingly, initiator caspase-8 of death receptor pathway is also inhibited after the treatment with betulin. GAPDH was used as reference gene. (B) Quantitative analysis of expression of apoptotic genes compared to control. *P<0.05 compared to control. **P<0.01; ***P<0.001. (C) Immunocytochemical analysis of major apoptotic markers after 48 hours treatment with betulin observed under fluorescent microscope at 20× magnification. The caspase-3 and caspase-6 are highly expressed in treated cells while caspase-8 is downregulated, suggesting activation of intrinsic pathway of apoptosis. Furthermore, anti-apoptotic BCL-2L1 show marked inhibition posttreatment.
Abbreviation: Int Den, integrated density.
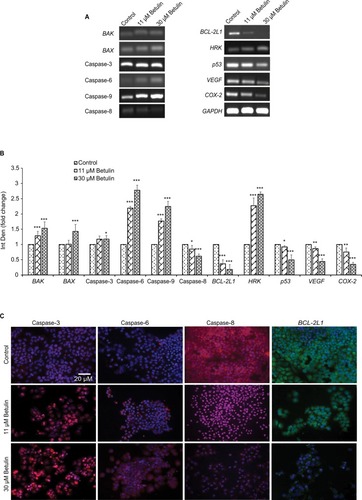
Figure 6 (A) The gene expression analysis of osteopontin in response to the treatment with betulin after 48 hours as observed via RT-PCR. The results show pronounced downregulation of expression of the marker in comparison to GAPDH, the reference gene. (B) Proteomic analysis of osteopontin compared with the untreated control studied through immunofluorescence assay under fluorescent microscope at 20× magnification. The expression of osteopontin in the cells after the treatment. (C) Proposed mechanism of osteopontin as central regulator of apoptosis and metastasis in H460 cells.
Abbreviation: MMP, matrix metalloproteinases.
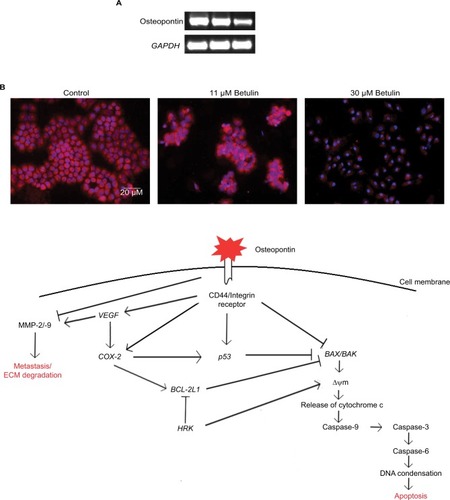
Figure 7 Synergistic effects of betulin with standard drug cisplatin as represented by (A) Fa-CI plot and (B) classic isobologram showing data points of individual drugs vs actual data points of their combination at different inhibitory concentrations observed through MTT assay.
Abbreviations: Fa, fraction affected; CI, combination index.
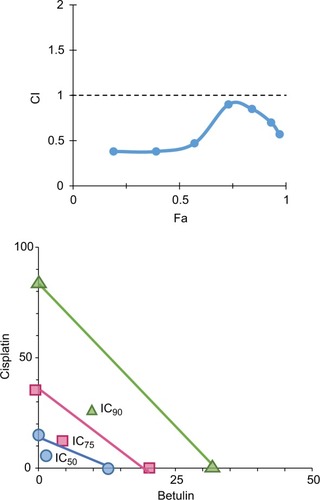
Figure S1 Effects on protein expression of (A) BCL-2L1, (B) caspase-3, (C) caspase-6, (D) caspase-8, (E) Ki-67, and (F) osteopontin after 48 h treatment with betulin at different concentrations.
Notes: DAPI staining indicates nuclei of cells, whereas FITC/TxR image shows expression of the respective marker under fluorescent microscope at 20× magnification.
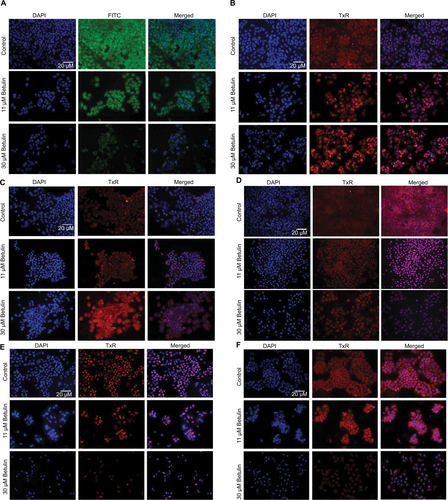
Table S1 Primer sequences of the genes used for RT-PCR.