
Figures & data
Figure 1 Overview of the study.
Abbreviation: GO, gene ontology.
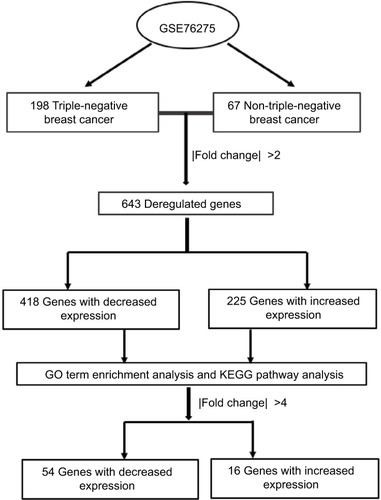
Table 1 Gene ontology analysis and KEGG pathway analysis of differentially expressed genes
Figure 2 The 16 upregulation identified genes.
Notes: (A) Details of the frequency alteration of the 16 identified upregulated genes in the cBio Cancer Genomics Portal. (B) The frequency of alteration. (C) HORMAD1 and SOX8 status in different subtypes of breast cancer.
Abbreviations: HER2, human epidermal receptor 2; TNBC, triple-negative breast cancer.
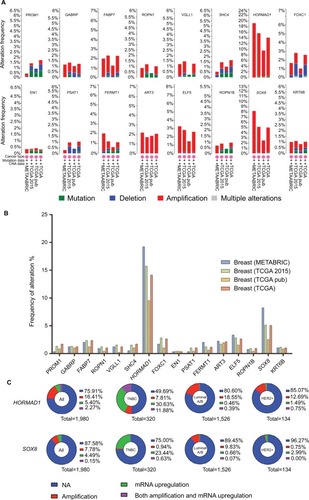
Table 2 The 16 upregulation identified genes
Figure 3 qRT-PCR validation of HORMAD1 and SOX8 expression in breast cancer.
Notes: HORMAD1 (A) and SOX8 (D) mRNA levels determined by qRT-PCR in a normal mammary cell line and in breast cancer cell lines. β-actin serves as the internal reference. The error bars represent the standard deviations from triplicates of one representative experiment. *P<0.05 and **P<0.01. (B) HORMAD1 mRNA levels in TNBC and the corresponding paired normal adjacent tissues (Normal 1). (C) HORMAD1 mRNA levels in non-TNBC and the corresponding paired normal adjacent tissues (Normal 2). (E) SOX8 mRNA levels in TNBC and the corresponding paired normal adjacent tissues (Normal 1). (F) SOX8 mRNA levels in non-TNBC and the corresponding paired normal adjacent tissues (Normal 2).
Abbreviations: qRT-PCR, quantitative RT-PCR analysis; TNBC, triple-negative breast cancer.
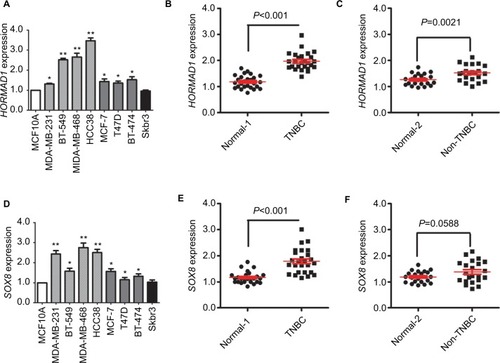
Figure 4 Association of HORMAD1 with RFS and OS in breast cancer (KM Plotter Tool cohort).
Notes: Kaplan–Meier survival curves of (A) RFS for breast cancer, (B) RFS for TNBC, (C) RFS for Luminal A/B, (D) RFS for HER2+ and (E) OS for breast cancer (left), ER-negative breast cancer (middle) and ER-positive breast cancer (right). Red line = high HORMAD1 group, black line = low HORMAD1 group. The cutoff value between high and low is computed by KM Plotter Tool, and the best performing threshold is used as a cutoff. Number at risk table below graph shows the number of cases that reached the endpoint (number of events), the number of cases that did not reach the endpoint (number censored) and the total number of cases.
Abbreviations: HER2, human epidermal receptor 2; OS, overall survival; RFS, relapse-free survival; TNBC, triple-negative breast cancer.
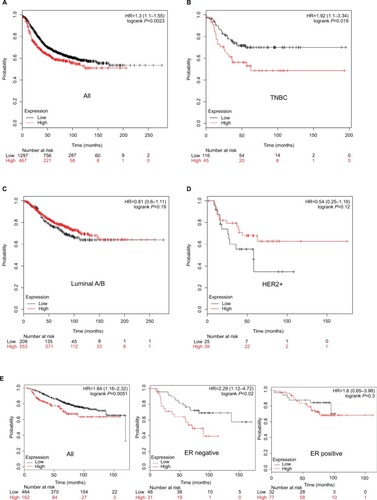
Figure 5 Association of HORMAD1 with prognosis in 240 TNBC patients from SYSUCC (SYSUCC cohort).
Notes: (A) DFS curves for 240 TNBC patients with high or low HORMAD1 levels. (B) OS curves for 240 TNBC patients with high or low HORMAD1 levels. Red line = high HORMAD1 group, black line = low HORMAD1 group.
Abbreviations: DFS, disease-free survival; OS, overall survival; SYSUCC, Sun Yat-sen University Cancer Center; TNBC, triple-negative breast cancer.
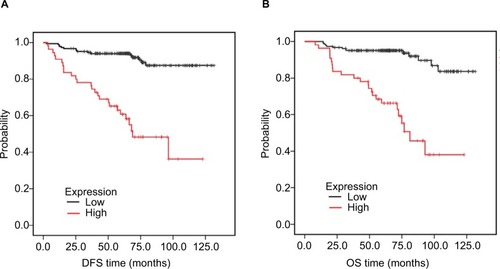
Table 3 Association between HORMAD1 and clinicopathological characteristics in triple-negative breast cancer