Figures & data
Figure 1 DEX inhibits proliferation and migration of HepG2 cells in vitro.
Notes: Inhibition of HEPG2 cells by different concentrations of DEX. The concentration of DEX is >50 µg/mL, and the inhibition effect is statistically significant (A). IC50 fitting curve of DEX, the IC50 of DEX was 329 µg/mL (B). Proliferative curve of inhibition of HEPG2 cells by 300 µg/mL DEX. After 2 days of treatment, the proliferation of the two groups of cells was statistically significant (C). Flow diagram and statistical diagram of the inhibit effect of DEX on HEPG2 cell cycle. After treatment with DEX, the proportion of cells in the G2/M phase of HepG2 cells was significantly downregulated, and the difference was statistically significant, indicating that DEX can inhibit the proliferation of HepG2 cells (D and E). Scratch test and statistical diagram of DEX inhibiting the migration ability of HEPG2 cells. After DEX treatment, the scratch closure rate of HepG2 cells was significantly reduced, and the difference was statistically significant, indicating that DEX can inhibit the migration ability of HepG2 (F and G). All data were analyzed by using chi-squared test. P<0.05 was considered to be significant (*P<0.05, **P<0.01, ***P<0.001, ****P<0.0001).
Abbreviation: DEX, dexamethasone.
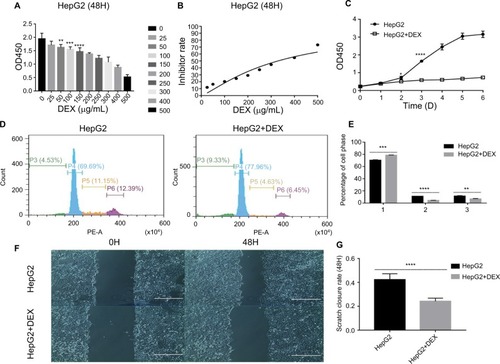
Figure 2 DEX inhibits HepG2 cells in vivo and its mechanisms.
Notes: DEX inhibits the growth of HEPG2 solid tumor volume and weight in vivo. After 12 days of DEX treatment, the difference in solid tumor volume between the control and the DEX groups was statistically significant. At the end of the experiment, solid tumors were weighed, and the difference in solid tumor weight between the control and the DEX groups was statistically significant (A and B). DEX inhibits the production of lactic acid in a cell culture medium. After DEX treatment, the lactic acid content in the medium was significantly reduced, and the difference was statistically significant, indicating that DEX can inhibit the glycolysis of HepG2 cells (C). Detection of expression of genes involved in glucose metabolism by DEX by real-time PCR (D). After DEX treatment, the expression of c-Myc, LDHA, and PCK1 in HepG2 cells was significantly decreased, whereas the expression of PCK2 and PDK4 was significantly increased. The difference was statistically significant; detection of the effect of DEX on the expression of PCK2 in HEPG2 xenografts by immunohistochemical (E). Western detection of the effect of DEX on PCK2, c-Myc, and p-mTOR in HEPG2 cells and tissues. After treatment with DEX, PCK2 was upregulated, c-Myc was downregulated, and p-mTOR was downregulated in HepG2 cells and solid tumors. The difference was statistically significant (F–H). Relationship between expression of PCK2 and patient prognosis of liver cancer in KM plotter database. Hepatocellular carcinoma patients with high expression of PCK2 had longer overall survival than patients with low expression of PCK2. The difference is statistically significant (I). All data were analyzed by using the chi-squared test. P<0.05 was considered to be significant (*P<0.05, **P<0.01, ***P<0.001, ****P<0.0001).
Abbreviations: DEX, dexamethasone; p-mTOR, phosphor-mammalian target of rapamycin.
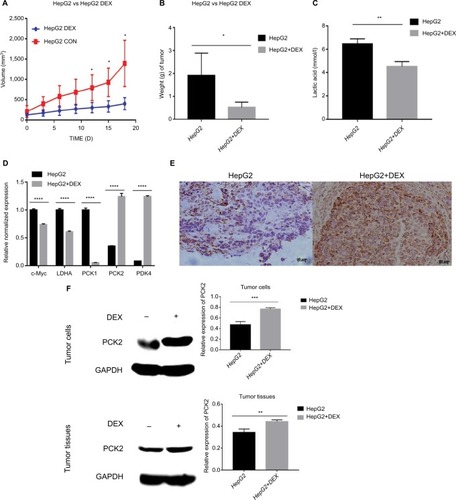
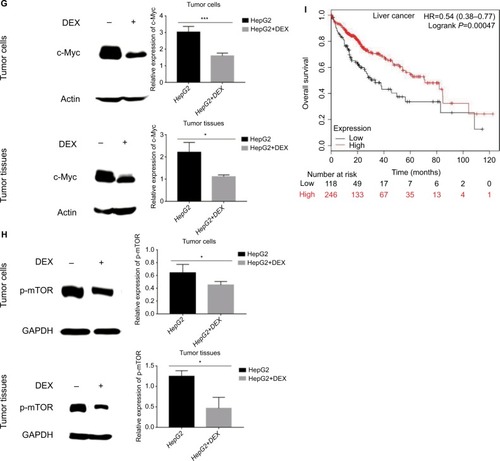
Figure 3 DEX inhibits tumor proliferation by affecting immune cells.
Note: DEX inhibits the growth of 4T1 xenografts in vivo. After 9 days of DEX treatment, the volume of transplanted tumors in the control and the DEX groups was statistically significant (A). DEX can reduce the spleen of tumor-bearing mice. Spleens 1 and 2 were in the DEX treatment group, and spleens 3 and 4 in the control group (B). Effect of DEX on CD4+ T cell, CD8+ T cells, and Treg cells in draining lymph nodes of 4T1 xenografts (C) and its statistic graph (D–F). After DEX treatment, CD4+/CD45+ and CD8+/CD45+ are upregulated, and Treg cells are downregulated. The MDSCs are downregulated in the tumor tissues, the difference is statistically significant (G and H). There was an effect of DEX on inflammatory factors in the tumor tissues: positively regulated cytokines like Granzyme B, IFN-γ, and il-1B were downregulated, and negatively regulated cytokines like IL-10 were upregulated. The difference was statistically significant (I). All data were analyzed by using chi-squared test. P<0.05 was considered to be significant (*P<0.05, **P<0.01, ***P<0.001, ****P<0.0001).
Abbreviations: DEX, dexamethasone; IFN, interferon; MDSC, myeloid-derived suppressor cells.
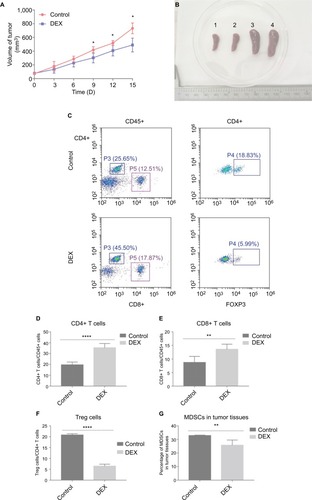
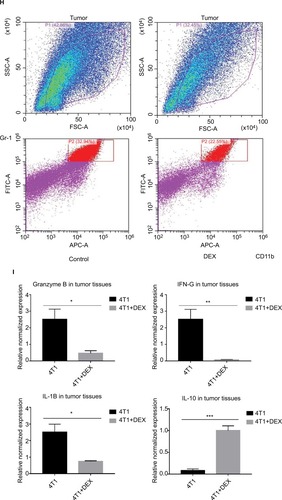
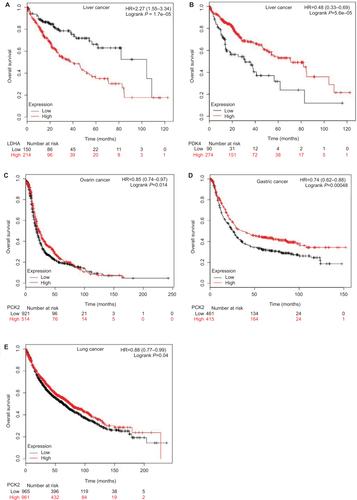
Figure S1 Kaplan–Meier survival curves of overall survival in patients with different cancers. Liver cancer patients with LDHA-low expression have a longer overall survival compared with those with LDHA-high expression (A). Liver cancer patients with PDK4-high expression have a longer overall survival compared with those with PDK4-low expression (B). Ovarian cancer patients with PCK2-high expression have a longer overall survival compared with those with PCK2-low expression (C). Gastric cancer patients with PCK2-high expression have a longer overall survival compared with those with PCK2-low expression (D). Lung cancer patients with PCK2-high expression have a longer overall survival compared with those with PCK2-low expression (E). The samples in different cancers cohort with top 50% expression levels for different proteins were grouped as high and those with bottom 50% were grouped as low.
Abbreviation: LDHA, lactate dehydrogenase A.