
Figures & data
Table 1 Sequences of primers in the qRT-PCR experiments in this study
Figure 1 PF4V1 is downregulated and has different prognostic values in OS and CSS in human PCa according to the TCGA database.
Notes: (A) The expression of PF4V1 was significantly lower in 492 PCa samples than in 52 normal prostate samples (unpaired Student’s t-test, P=0.0012). (B) The expression of PF4V1 was significantly lower in PCa samples with different Gleason scores, compared with normal prostate samples (unpaired Student’s t-test, *P<0.05, **P<0.01, ***P<0.001). (C) Kaplan–Meier survival analysis for 490 patients with PCa stratified by high or low PF4V1 expression showed that high PF4V1/TP53 was significantly associated with good OS (P<0.05). (D) Kaplan–Meier survival analysis for 490 patients with PCa stratified by high or low PF4V1 expression showed that high PF4V1/TP53 was significantly associated with poor DFS (P<0.05).
Abbreviations: CSS, cancer-specific survival; DFS, disease-free survival; OS, overall survival; PCa, prostate cancer; TCGA, The Cancer Genome Atlas.
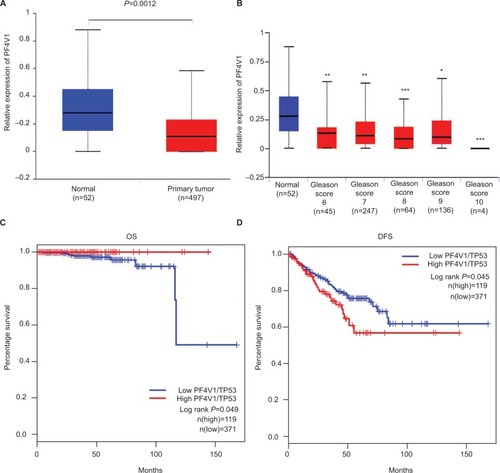
Figure 2 In vitro, PF4V1 is downregulated and suppresses the proliferation, migration, and invasion of PCa cells.
Notes: (A) The relative expression of PF4V1 was investigated by qRT-PCR in PCa cell lines PC-3, LNCaP, DU145, and 22RV1 and a normal human prostate cell line WPMY-1. GAPDH was used as an internal control. (B) The expression of PF4V1 at protein level was evaluated by Western blotting. (C) The relative expression of PF4V1 was investigated by qRT-PCR in PCa cell lines DU145 and LNCaP after lentivirus transfection. (D) The expression of PF4V1 at protein level was evaluated by Western blotting after lentivirus transfection. (E) The effects of PF4V1 on the proliferation of (i) DU145 and (ii) LNCaP cells were evaluated by CCK-8 tests. (F) The effects of PF4V1 on the proliferation of (i) DU145 and (ii) LNCaP cells were evaluated by colony formation tests. (G) The effects of PF4V1 on the migration of (i) DU145 and (ii) LNCaP cells were evaluated by wound healing assays. (H) The effects of PF4V1 on the migration of (i) DU145 and (ii) LNCaP cells were evaluated by Transwell® assays. (I) The effects of PF4V1 on the invasion of (i) DU145 and (ii) LNCaP cells were evaluated by Transwell® assays with Matrigel®. The results were acquired from three independent experiments, and error bars represent mean and SD (Student’s t-test, *P<0.05, **P<0.01, ***P<0.001).
Abbreviations: CCK-8, Cell Counting Kit-8; PCa, prostate cancer; qRT-PCR, quantitative real-time PCR.
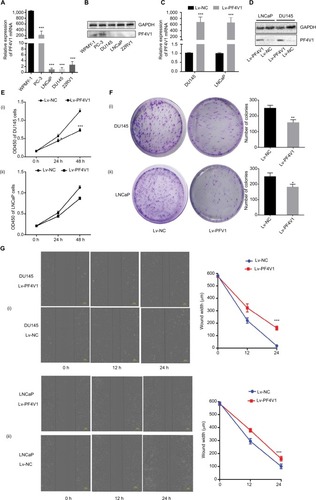
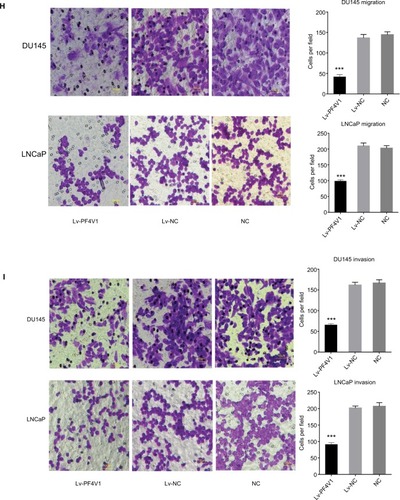
Figure 3 PF4V1 suppresses the AKT/ERK pathway and EMT process in prostate cancer.
Notes: Western blotting analysis of the potential downstream targets of PF4V1. The AKT, p-AKT, ERK, p-ERK, SRC-1, E-cadherin, N-cadherin, Snail, Slug, and GAPDH were tested by Western blotting in DU145 (A) and LNCaP (B) cells after Lv-NC or Lv-PF4V1 transfection.
Abbreviation: EMT, epithelial–mesenchymal transition.
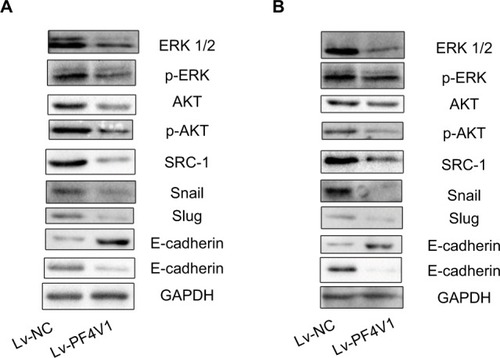
Figure 4 In vivo PF4V1 suppresses the growth of prostate cancer in nude mice model.
Notes: (A) The sample tumors from the nude mice at 21 days are shown. (B) The tumor weight was significantly lower in PF4V1 treatment group than in the control group. (C) The tumor volume was measured every 3 days. The results were acquired from three independent experiments, and error bars represent mean and SD (Student’s t-test, ***P<0.001).
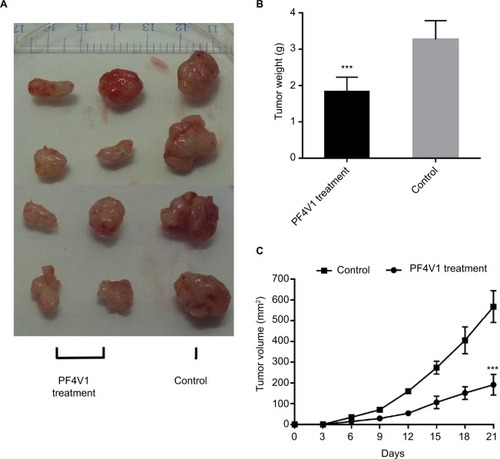
Figure 5 PF4V1 is a target of hsa-miR-875-3p at specific 3′-UTR.
Notes: (A) The effects of different miRNAs on the proliferation of DU145-Lv-PF4V1 cells were evaluated by CCK-8 tests. (B) The relative expression of PF4V1 was investigated by qRT-PCR in PCa cell lines DU145 and LNCaP after mimics transfection. (C) The relative expression of PF4V1 protein was investigated by Western blotting in PCa cell lines DU145 and LNCaP after mimics transfection. (D) The GV272 dual-luciferase reporter vector. (E) The 3′-UTR of PF4V1 harbors an miR-875-3p cognate site. (F) Relative luciferase activity was measured after cotransfecting miR-875-3p/NC mimics and reporter plasmids carrying mutant or wild-type PF4V1 3′-UTR in DU145 cells. (G) Relative luciferase activity was measured after cotransfecting miR-875-3p/NC mimics and reporter plasmids carrying mutant or wild-type PF4V1 3′-UTR in LNCaP cells. The results were acquired from three independent experiments, and error bars represent mean and SD (Student’s t-test, *P<0.05, **P<0.01, ***P<0.001).
Abbreviations: CCK-8, Cell Counting Kit-8; NC, negative control; PCa, prostate cancer; qRT-PCR, quantitative real-time PCR; MCS, multiple cloning site; WT, wild type; Mut,mutant; UTR, untranslated region.
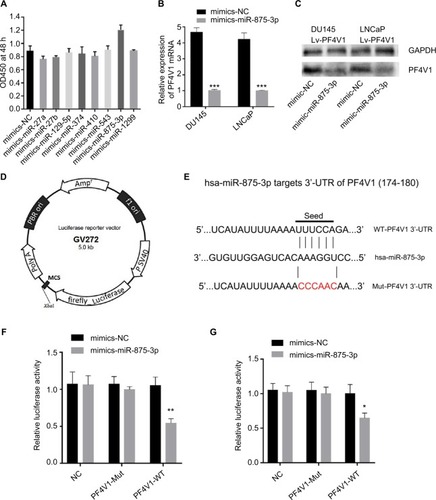
Figure 6 MiR-875-3p can derepress the effects on PCa cells proliferation, migration, and invasion from PF4V1.
Notes: (A) The relative expression of miR-875-3p was investigated by qRT-PCR in PCa cell lines DU145 and LNCaP after the miR-875-3p mimics/inhibitor transfection. (B) The effects of miR-875-3p and PF4V1 on the proliferation of (i) DU145 and (ii) LNCaP cells were evaluated by CCK-8 tests. (C) The effects of miR-875-3p and PF4V1 on the migration of (i) DU145 and (ii) LNCaP cells were evaluated by wound healing assays. (D) The effects of miR-875-3p and PF4V1 on the invasion of (i) DU145 and (ii) LNCaP cells were evaluated by Transwell® assays with Matrigel®. The results were acquired from three independent experiments, and error bars represent mean and SD (Student’s t-test, *P<0.05, **P<0.01, ***P<0.001).
Abbreviations: CCK-8, Cell Counting Kit-8; NC, negative control; PCa, prostate cancer; qRT-PCR, quantitative real-time PCR.
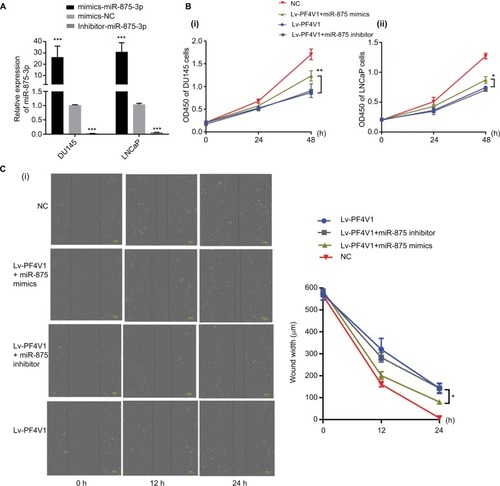
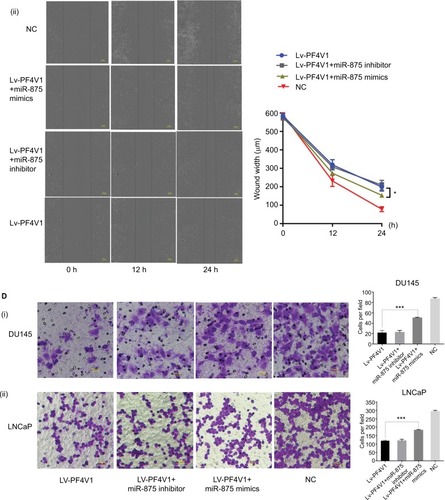
Table S1 Relationship between PF4V1 and clinical/pathological parameters of prostate cancer