Figures & data
Table 1 Distribution of patients with mCRC according to the tumor molecular subtype
Figure 1 Expression of CLDN genes.
Notes: (A) Mean expression of 18 CLDN genes in NM (n=17), PT (n=20), and HM (n=19). The Affymetrix RNA expression data were log2 transformed. (B) Detailed analysis of the RNA expression levels of six CLDN genes in the NM, PT, and HM samples described in (A). Horizontal bars indicate the mean value. ***P<0.001= (Kruskal–Wallis test).
Abbreviations: CRC, colorectal cancer; HM, hepatic metastases; NM, normal mucosa; PT, primary CRC tumors.
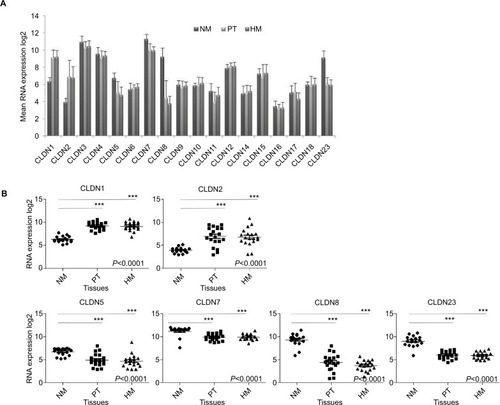
Figure 2 Interrelationships between the consensus classification (four subtypes: CMS1 to 4) and the Marisa’s classification (six molecular subtypes: C1 to C6) of the 143 CRC samples included in this study.
Notes: (A) Chord diagram to visualize the relationships among subtypes (in different colors) of the two CRC classifications arranged radially. Data are connected to each other using arcs; each connection is proportional to the arc size. (B) Percentage of CRC samples classified as C1 to C6 included in each CMS subtype.
Abbreviation: CRC, colorectal cancer.
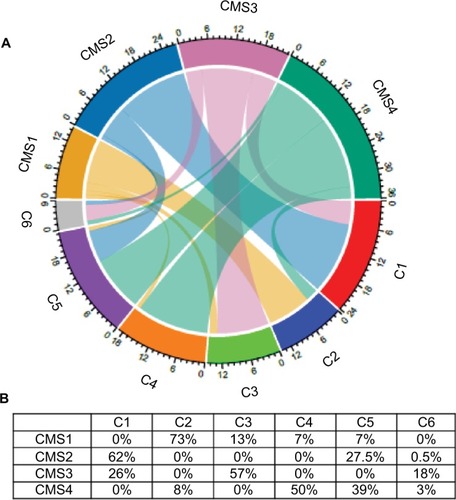
Figure 3 Differential CLDN expression in CRC samples classified using the CMS classification.
Notes: (A) CLDN genes upregulated in tumor samples compared with normal mucosa. (B) CLDN genes downregulated in tumors compared with normal mucosa. (C) CLDN genes with similar expression in normal mucosa and tumor samples. The red horizontal line indicates CLDN expression in normal mucosa within the CRC samples. The arrow highlights the subtype where CLDN expression is the most significantly different compared with the other subtypes (Kruskal–Wallis/Dunn’s test). *P<0.05; **P<0.01; ***P<0.001.
Abbreviation: CRC, colorectal cancer.
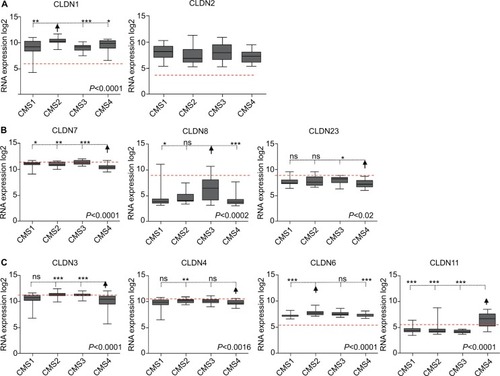
Figure 4 Clinical value of CLDN gene expression in the 143 CRC samples.
Notes: Association between CLDN2 and CLDN4 gene expression levels and (A) OS and (B) PFS (log-rank test). High and low: higher or lower expressions relative to the median expression for that CLDN gene. (C) Association of combined CLDN2 and CLDN4 gene expressions with OS.
Abbreviations: CRC, colorectal cancer; OS, overall survival; PFS, progression-free survival.
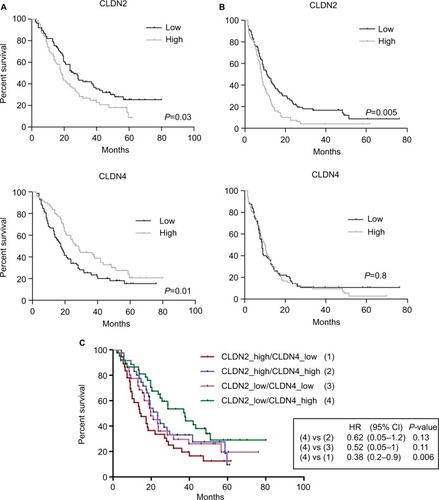
Figure 5 Association of CLDN gene expression with OS in the different CRC subtypes.
Notes: Log-rank test. High/low: expression higher/lower than the median value for that CLDN gene.
Abbreviation: CRC, colorectal cancer; OS, overall survival.
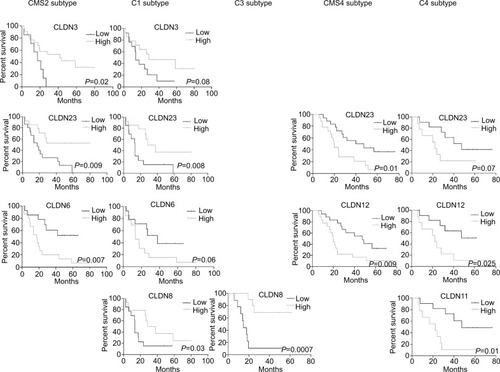
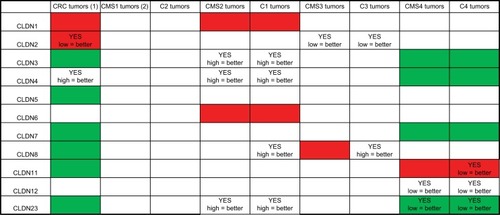
Figure 6 Summary of CLDN gene expression and prognostic value in CRC.
Notes: (1) Expression in CRC samples (n=20) compared with normal mucosa samples (n=17); red = upregulated; green = downregulated; white, no expression difference with normal mucosa. (2) Comparison of CLDN expression in the different CRC subtypes; red = subtype where CLDN expression is strongest; green = subtype where the expression of that CLDN gene is lowest compared with the other subtypes; white = no expression difference among subtypes. YES indicates that the expression level of that CLDN gene shows prognostic value, with the correlation between CLDN expression level (high/low relative to the median expression of that gene) and improved prognosis.
Abbreviation: CRC, colorectal cancer.