Figures & data
Figure 1 Expression of COL5A1 in tissue and cell lines.
Notes: (A) Representative COL5A1 immunohistochemical images (200×) in adjacent normal tissue and ccRCC tissue. COL5A1 protein expression in the ccRCC tissue was significantly higher than that in the adjacent normal tissue. (B) Western blot detection of COL5A1 protein expression in HK-2, 786-O, and Caki-1 cells. COL5A1 protein was upregulated in ccRCC cell lines in comparison with HK-2 cells. GAPDH was used as loading control. (C) COL5A1 mRNA expression in HK-2, 786-O, and Caki-1 cells. The ccRCC cell lines showed a significantly higher COL5A1 mRNA expression in comparison with HK-2 (all P<0.05).
Abbreviation: ccRCC, clear cell renal cell carcinoma.
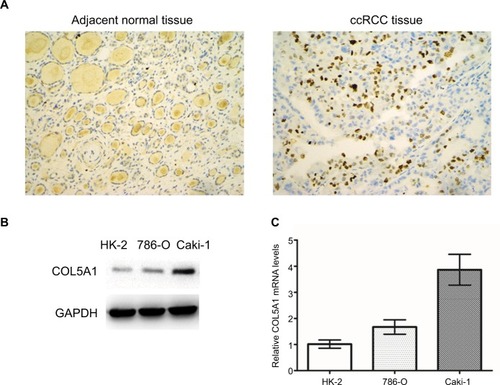
Table 1 The expression of COL5A1 protein in ccRCC tissue and paired adjacent normal tissue
Table 2 The relationship of COL5A1 with the clinicopathological characteristics of patients with ccRCC
Figure 2 COL5A1 mRNA is correlated with survival of ccRCC patients.
Notes: (A) COL5A1 mRNA expression in patients with localized and metastatic ccRCC. Patients with metastatic ccRCC had significantly higher COL5A1 mRNA expression compared to patients with localized ccRCC (P<0.05). (B) Kaplan–Meier curves for OS after surgery. Patients with high COL5A1 mRNA expression had poor OS (log-rank test, P<0.001). (C) COL5A1 mRNA expression in ccRCC patients with and without recurrence. Patients with recurrence had significantly higher COL5A1 mRNA expression compared to patients without recurrence (P<0.05). (D) Kaplan–Meier curves for RFS after surgery. Patients with high COL5A1 mRNA expression had poor RFS (log-rank test, P<0.001).
Abbreviations: ccRCC, clear cell renal cell carcinoma; OS, overall survival; RFS, recurrence-free survival.
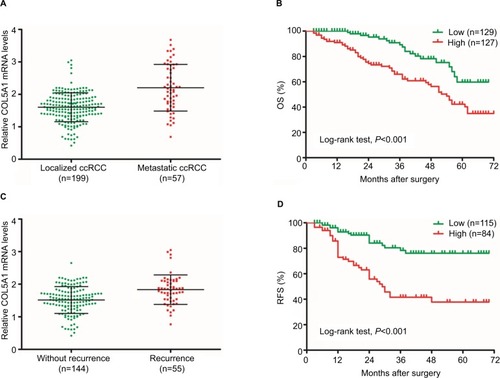
Table 3 Univariate and multivariate analyses for predicting overall survival of patients with ccRCC (n=256)
Table 4 Comparison of the prognostic accuracy of the prognostic models and COL5A1 expression for predicting overall survival of patients with ccRCC
Table 5 Univariate and multivariate analyses for predicting recurrence-free survival of patients with localized ccRCC (n=199)
Table 6 Comparison of the prognostic accuracy of the prognostic models and COL5A1 expression for predicting recurrence-free survival of patients with localized ccRCC
Figure 3 Effect of COL5A1 knockdown on cell proliferation and apoptosis in vitro.
Notes: (A) Effect of COL5A1 knockdown in Caki-1 cells was determined by real-time PCR and Western blot analysis. (B) Cell viability was assessed by MTT assay at 0, 24, 48, 72, and 96 hours after treatment with siRNA. Knockdown of COL5A1 inhibited Caki-1 cells proliferation. (C) Effect of COL5A1 on colony formation of Caki-1 cells. Knockdown of COL5A1 caused significant reduction of colony number (P<0.05). (D) Apoptosis assay with Caki-1 was done 48 hours post-siRNA transfection by flow cytometric analyses. Knockdown of COL5A1 significantly increased Caki-1 cells apoptosis (P<0.05).
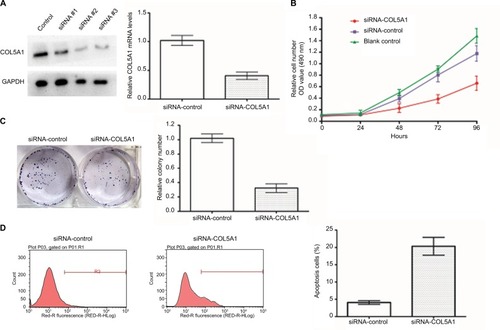
Figure 4 Effect of COL5A1 knockdown on cell migration and invasion in vitro.
Notes: (A) Representative images of wound healing assay. Knockdown of COL5A1 significantly inhibited Caki-1 cells migration. (B) Representative images of crystal violet-stained migrated cells. Knockdown of COL5A1 significantly inhibited Caki-1 cells invasion.
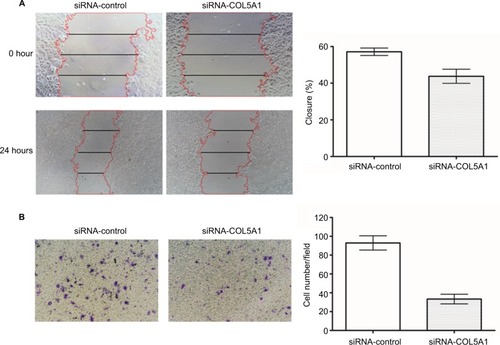
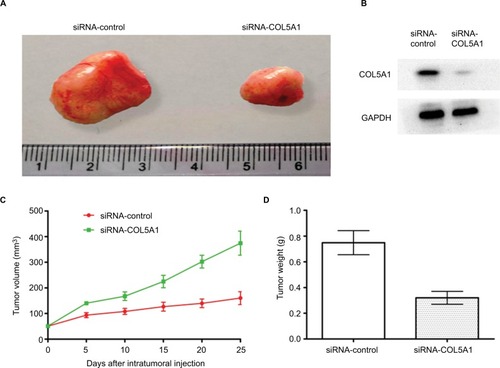
Figure 5 Effect of COL5A1 knockdown on tumor growth in vivo.
Notes: (A) Knockdown of COL5A1 by siRNA inhibited the growth of Caki-1-derived xenografts in nude mice. (B) Knockdown of COL5A1 inhibited COL5A1 protein expression in vivo. (C) The tumor growth curves of the tumor xenografts. (D) The tumor weight of siRNA-control group and siRNA-COL5A1 group (P<0.05).